.svg)

Sep-2026
Sales
Trend
6-Month
Product Count
SKUs
Avg Price
YoY Sales Change
YoY Price Change


Where to Buy
Dabble Extracts is stocked at 69 licensed dispensaries across Colorado, with the deepest coverage in Colorado Springs, Denver, Pueblo West, Sheridan, and Pagosa Springs. Search by ZIP code or city below to find the closest one, or filter by product type if you are after a specific format.
Market Insights Snapshot
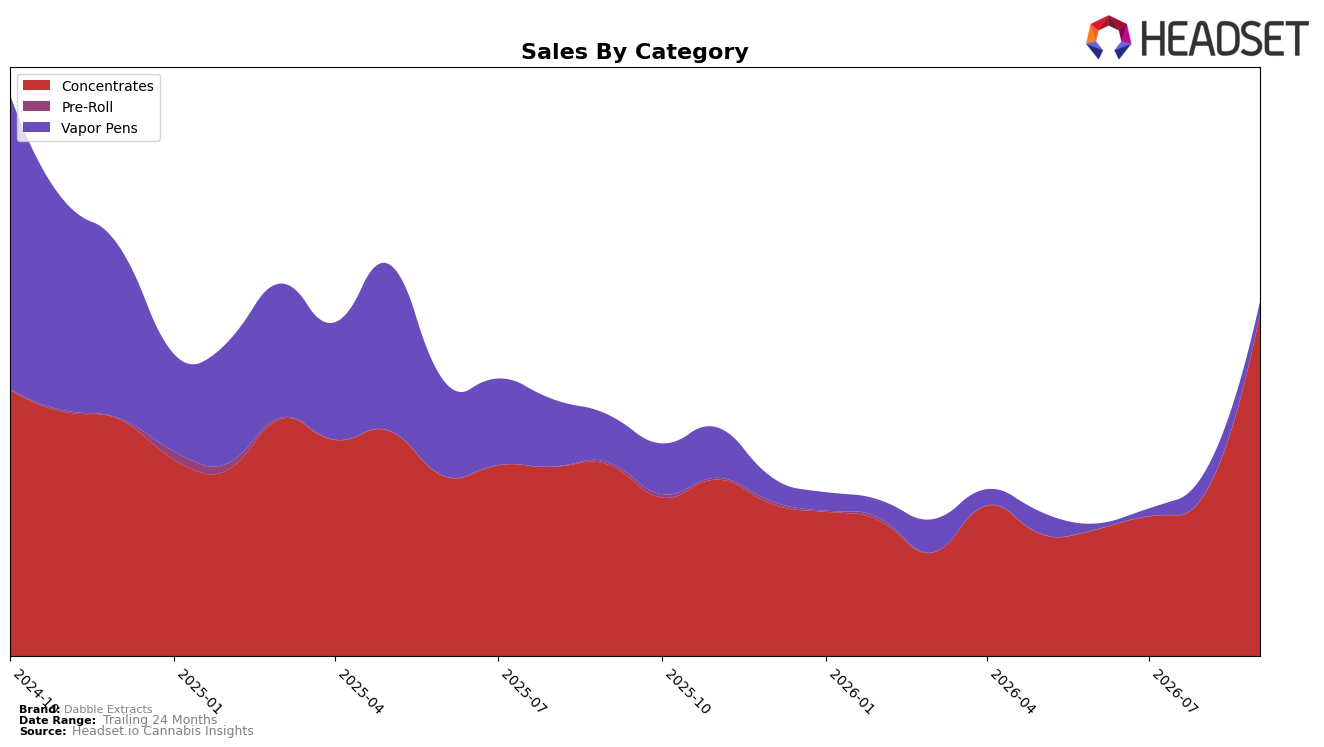
In September 2026, Dabble Extracts concentrated its sales mix even further into Concentrates, which held 96.63% share with year-over-year growth of 78.79% and month-over-month acceleration of 111.37%, while Vapor Pens fell to 3.37% share with a year-over-year decline of 74.71% and a month-over-month drop of 44.25%. Average price rose 43.03% year over year to $21.46, with Concentrates averaging $21.64 and Vapor Pens at $17.31, indicating mix and pricing combined to lift total brand sales 47.11% year over year despite a 24‑month decline of 35.01%. With Concentrates ranked 3 in British Columbia and CO as the top state, the pattern implies the brand is consolidating around a high‑velocity Concentrates core while de‑emphasizing Vapor Pens.
The sharp month-over-month gain of 111.37% in Concentrates alongside a 44.25% month-over-month contraction in Vapor Pens implies deliberate inventory and promotional weighting toward the highest‑return format, supported by a 78.79% year-over-year surge that offsets the Vapor Pens’ 74.71% year-over-year decline. Coupled with a 43.03% average price increase and a 96.63% category share, the mix signals premium‑leaning price realization within Concentrates and a retreat from lower‑priced Vapor Pens, positioning Dabble Extracts to defend rank 3 in British Columbia and deepen share in CO as the Concentrates-led strategy scales.
Competitive Landscape
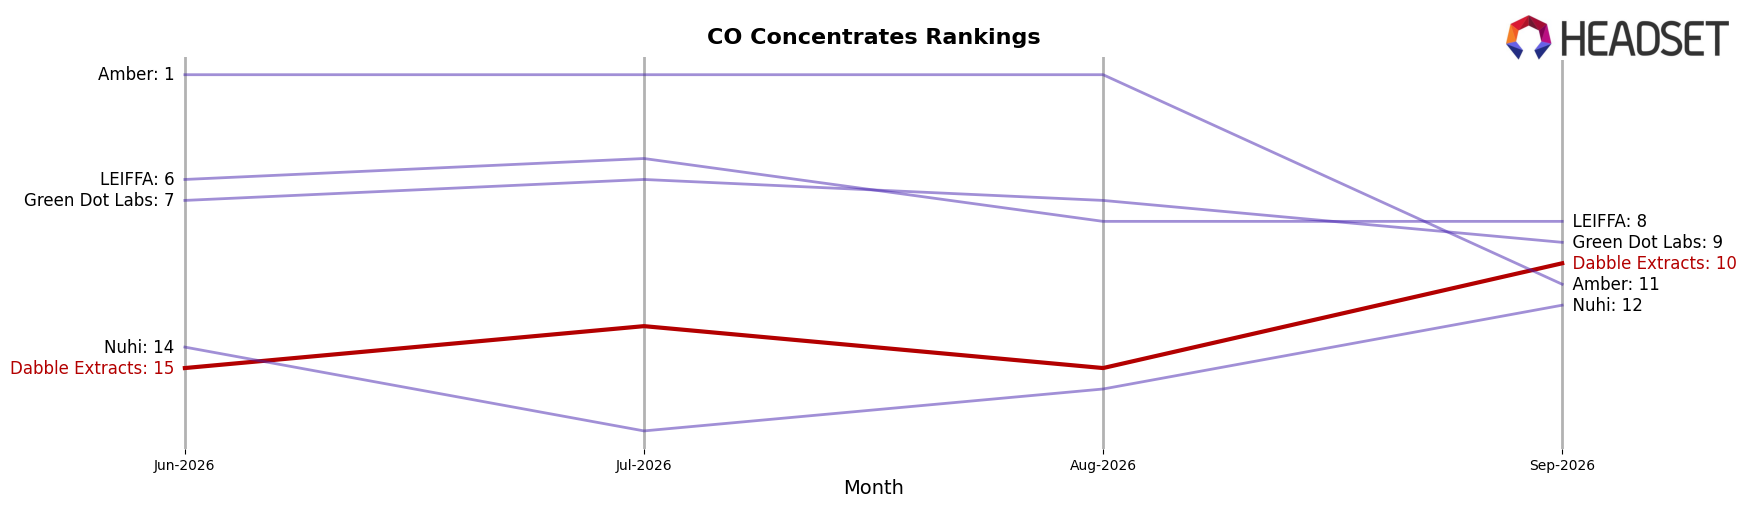
Dabble Extracts sits at rank #10 in CO Concentrates for September 2026, improving 4 positions from #14 year over year and climbing 5 spots from #15 three months ago; against that backdrop, 710 Labs holds #1 after a 1-position gain from #2 despite a 18.6% YoY sales decline, while Sunshine Extracts advanced from #6 to #2 on 49.9% YoY growth and Denver Dab Co moved from #8 to #4 with 56.8% YoY gains; given Dabble Extracts’ prior peak at #5 in October 2024 and current rebound, the trajectory implies regained relevance but a widening gap versus the fastest risers at the top end.
Notable Products
Mexicola Live Hash Rosin (1g) delivered the headline move in September 2026 with a +547.9% month-over-month surge that vaulted it to rank 1, concentrating a disproportionate share of momentum at the very top and indicating a rapid channel pull-through for premium live rosin. With nine of the top ten SKUs in Concentrates and only one in Vapor Pens at rank 9, the category mix is skewed toward dabbable formats, while Honey Banana Wax (1g) at rank 7 rose +35.3% and Blueberry Muffin Cured Budder (1g) at rank 8 climbed +29.6%, reinforcing depth beyond the leader; the outlier dollar volume of about $189,654 attached to the top SKU underlines how winner-take-most dynamics can reshape the lineup. The rank spread from 1 to 10 alongside double-digit growth pockets (+27.7% to +35.3%) implies Dabble Extracts is consolidating around high-velocity Concentrates, prioritizing premium rosin-led demand over breadth across formats.
Top Selling Cannabis Brands






Data for this report comes from real-time sales reporting by participating cannabis retailers via their point-of-sale systems, which are linked up with Headset’s business intelligence software. Headset’s data is very reliable, as it comes digitally direct from our partner retailers. However, the potential does exist for misreporting in the instance of duplicates, incorrectly classified products, inaccurate entry of products into point-of-sale systems, or even simple human error at the point of purchase. Thus, there is a slight margin of error to consider. Brands listed on this page are ranked in the top twenty within the market and product category by total retail sales volume.

