.svg)

Aug-2026
Sales
Trend
6-Month
Product Count
SKUs
Avg Price
YoY Sales Change
YoY Price Change


Where to Buy
Denver Dab Co is stocked at 109 licensed dispensaries across Colorado, with the deepest coverage in Denver, Colorado Springs, Aurora, Longmont, and Boulder. Search by ZIP code or city below to find the closest one, or filter by product type if you are after a specific format.
Market Insights Snapshot
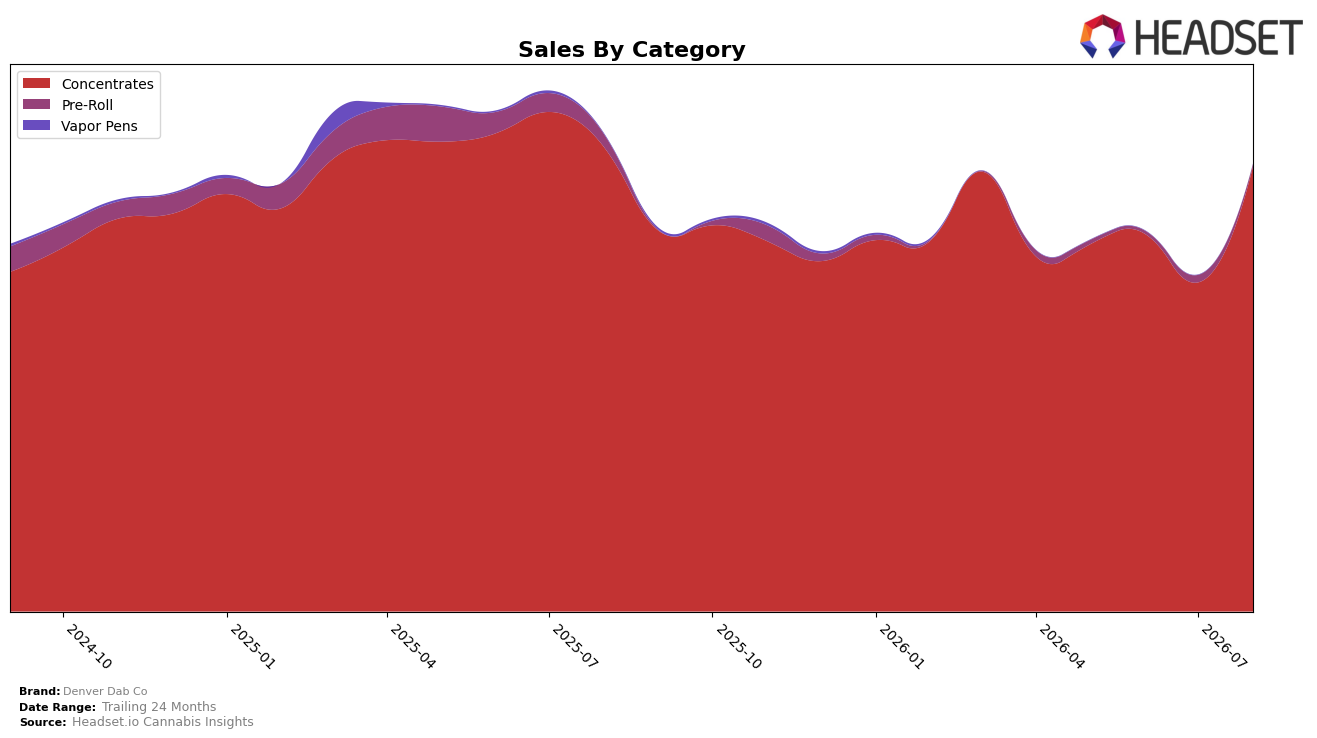
Denver Dab Co’s August 2026 mix is overwhelmingly Concentrates at 99.56% share, with Pre-Roll reduced to 0.44% share, indicating a sharper tilt toward its core. Within Concentrates, month-over-month sales rose 35.39% while year-over-year fell 4.11%, whereas Pre-Roll plunged 71.92% MoM and 84.18% YoY, reinforcing the concentration of volume in one category. Despite an 8.48% YoY decrease in average price and a 6.32% YoY decline in total brand sales, the August 2026 category allocation suggests the brand is consolidating around Concentrates to stabilize velocity after a soft prior-year compare.
The pivot has positioning consequences: a 99.56% Concentrates share coupled with a 35.39% MoM lift in that category points to a volume-led recovery strategy at lower price points, while the 84.18% YoY collapse in Pre-Roll and 71.92% MoM drop indicate intentional deprioritization rather than temporary volatility. With a current rank of 7 in Concentrates in Colorado and brand sales down 6.32% YoY, the brand trades breadth for depth; this implies maintaining relevance through a tighter SKU set in a single category where incremental share gains are more attainable than relaunching underperforming formats.
Competitive Landscape
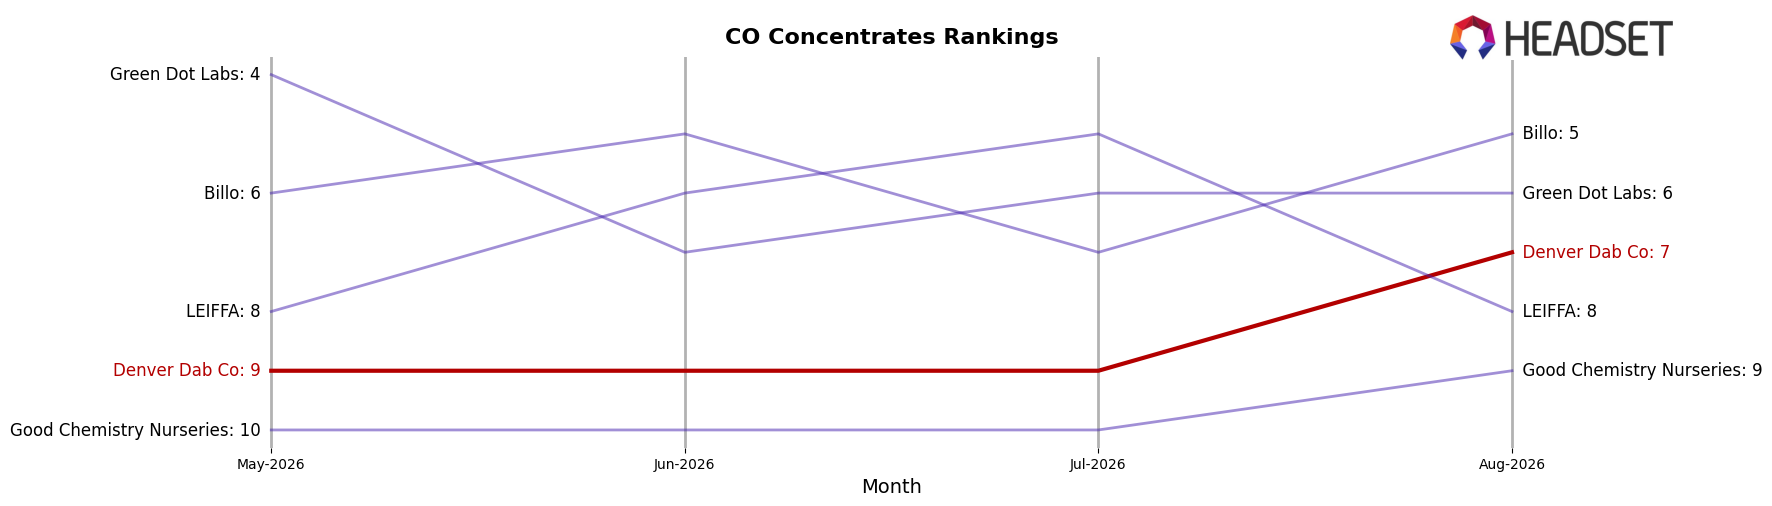
Denver Dab Co is ranked #7 in Colorado Concentrates in August 2026, improving 2 positions from #9 year over year, and up 2 ranks from #9 in May–June to #7 by August while still below its peak #6 from July 2025; meanwhile, Amber advanced from #2 to #1 with a 18.6% year-over-year sales increase and 710 Labs slipped from #1 to #3 alongside a 10.1% sales decline, indicating that Denver Dab Co’s incremental climb amid top-tier reshuffling points to durable mid-pack positioning unless it converts rank stability into share gains.
Notable Products
With no month-over-month deltas reported for August 2026, the actionable movement sits in rank stratification: Thin Mints Wax (1g) is locked in a tie at rank 8 while Trop Cherry Punch Wax (1g) holds rank 1 and Gusher Mints Wax (1g) sits at rank 2, implying a narrow spread at the top despite differing dollar totals ($6,880 for Gusher Mints Wax (1g)). Across the top ten, 100% of SKUs are Concentrates and five of the top six positions are Wax SKUs, concentrating demand in 1g Wax formats while Sugar Wax variants cluster at ranks 3, 4, 5, and 9. The split between two leaders at ranks 1–2 and a mid-pack tie at rank 8 suggests assortment headroom is in reinforcing flagship Wax SKUs while selectively pruning overlapping Sugar Wax entries to prevent intra-brand cannibalization.
Top Selling Cannabis Brands






Data for this report comes from real-time sales reporting by participating cannabis retailers via their point-of-sale systems, which are linked up with Headset’s business intelligence software. Headset’s data is very reliable, as it comes digitally direct from our partner retailers. However, the potential does exist for misreporting in the instance of duplicates, incorrectly classified products, inaccurate entry of products into point-of-sale systems, or even simple human error at the point of purchase. Thus, there is a slight margin of error to consider. Brands listed on this page are ranked in the top twenty within the market and product category by total retail sales volume.

