.svg)


Where to Buy
Noot is stocked at 29 licensed dispensaries across Colorado, with the deepest coverage in Denver, Boulder, Colorado Springs, Grand Junction, and Pueblo West. Search by ZIP code or city below to find the closest one, or filter by product type if you are after a specific format.
Market Insights Snapshot
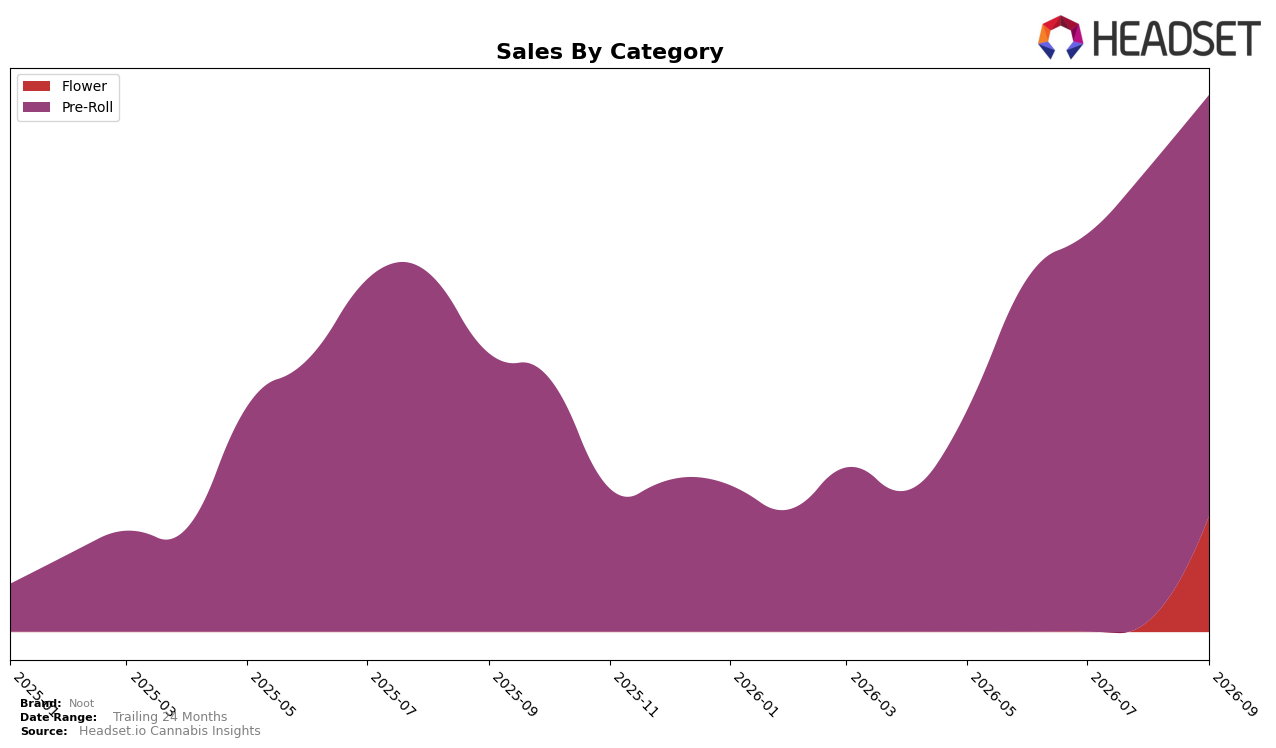
Noot concentrated 78.28% of September 2026 sales in Pre-Roll, while Flower accounted for 21.72%, indicating a heavier tilt than a typical 60/40 mix. Pre-Roll sales grew 51.31% year over year but fell 7.14% month over month, whereas Flower surged 1007.46% month over month with no year-over-year baseline, shifting mix rapidly within a single month. Average price declined 1.77% year over year to $32.94, with Pre-Roll pricing at $30.87 and Flower at $43.48. In Colorado Pre-Roll, Noot held rank 9, pairing a top-10 position with a short-term pullback in its lead category; the pattern implies reliance on Pre-Roll scale for rank stability while incremental mix from Flower buffers month-to-month volatility.
The swing toward Flower on a 1007.46% month-over-month rise alongside a 7.14% Pre-Roll dip suggests Noot is using higher-priced Flower ($43.48) to offset soft Pre-Roll volumes, even as overall brand sales rose 93.28% year over year. With 78.28% of sales still in Pre-Roll and a rank of 9 in Colorado, the brand’s near-term positioning leans on Pre-Roll penetration while selectively expanding Flower to lift basket value; this combination implies a hedged strategy that preserves category share in Pre-Roll and targets incremental gains from premium-led Flower without overexposing the portfolio to single-category drawdowns.
Competitive Landscape
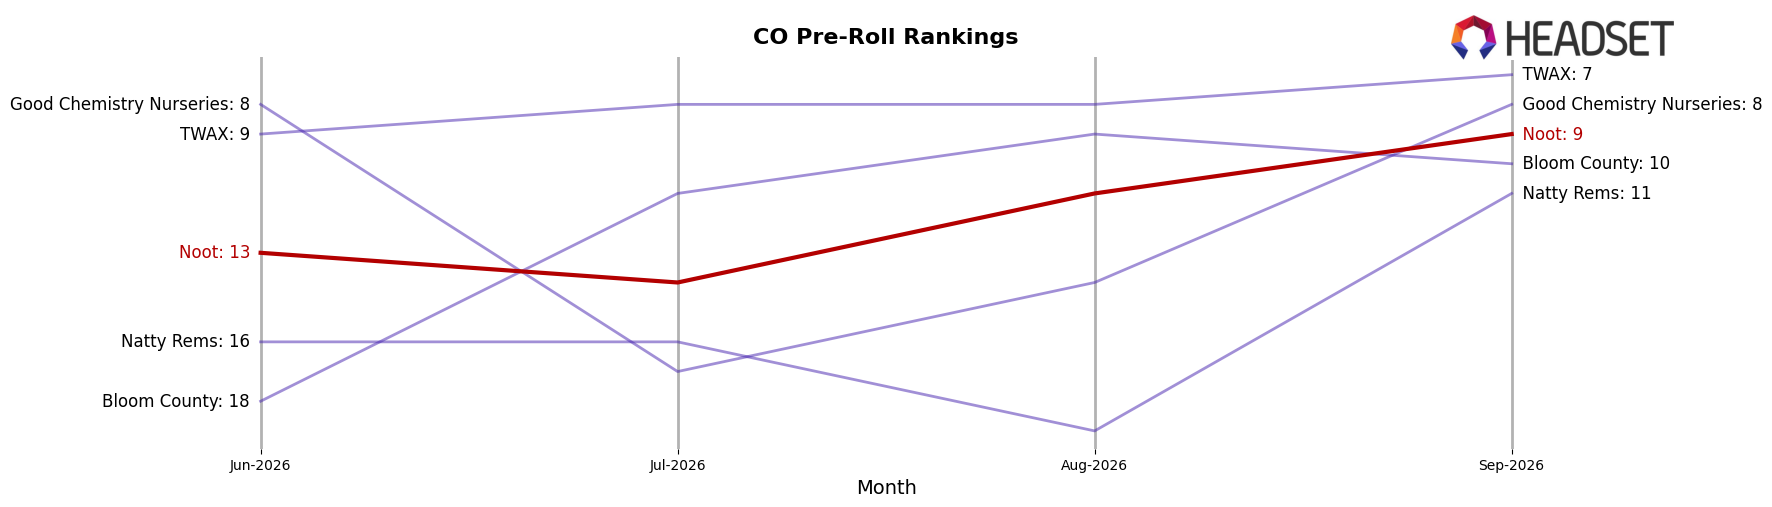
Noot ranks #9 in CO Pre-Roll in September 2026, improving 4 positions from #13 year over year, and matching a 4-rank climb from #13 in June 2026 to its peak of #9 in September 2026; by contrast, Cali-Blaze moved up 1 spot to #1 from #2 with 67.2% YoY sales growth while Green Label Cannabis slipped 1 position from #1 to #2 despite 14.5% YoY growth. The gap in upward velocity is starker versus Be One Kind, which jumped 18 ranks from #22 to #4 alongside a 463.7% YoY sales surge, while Kaviar fell from #4 to #5 with a -5.0% YoY decline; this mix signals that Noot’s steady rise into the top 10 is more about incremental share capture than breakout momentum, implying the brand must accelerate assortment or pricing moves to defend against faster climbers.
Notable Products
Cap Junkie (14g) posted the standout move in September 2026 with a +2,229.9% month-over-month surge while debuting inside the top 10 at rank 8, as Indica Blend Pre-Roll 6-Pack (3.5g) slid -18.4% to rank 3. Sativa Blend Pre-Roll 6-Pack (3.5g) grew +9.2% to hold rank 1, whereas Hybrid Pre-Roll 6-Pack (3.5g) declined -7.5% at rank 2, signaling share rotation within the pre-roll trio at the top. With four of the top ten being 14g Flower SKUs and Banana Kush (14g) at rank 5 up +2,583.0% alongside Jungle Pie (14g) up +1,172.5% at rank 7, the assortment is tilting toward large-format flower even as pre-rolls anchor positions 1–3. This pattern implies Noot is leveraging pre-roll leadership to funnel trial into value-oriented 14g flower, shifting mix toward higher-volume pack sizes while protecting rank density at the top; the $143,009 on Sativa Blend Pre-Roll 6-Pack (3.5g) underlines the base that funds this push.
Top Selling Cannabis Brands






Data for this report comes from real-time sales reporting by participating cannabis retailers via their point-of-sale systems, which are linked up with Headset’s business intelligence software. Headset’s data is very reliable, as it comes digitally direct from our partner retailers. However, the potential does exist for misreporting in the instance of duplicates, incorrectly classified products, inaccurate entry of products into point-of-sale systems, or even simple human error at the point of purchase. Thus, there is a slight margin of error to consider. Brands listed on this page are ranked in the top twenty within the market and product category by total retail sales volume.

