Market Insights Snapshot
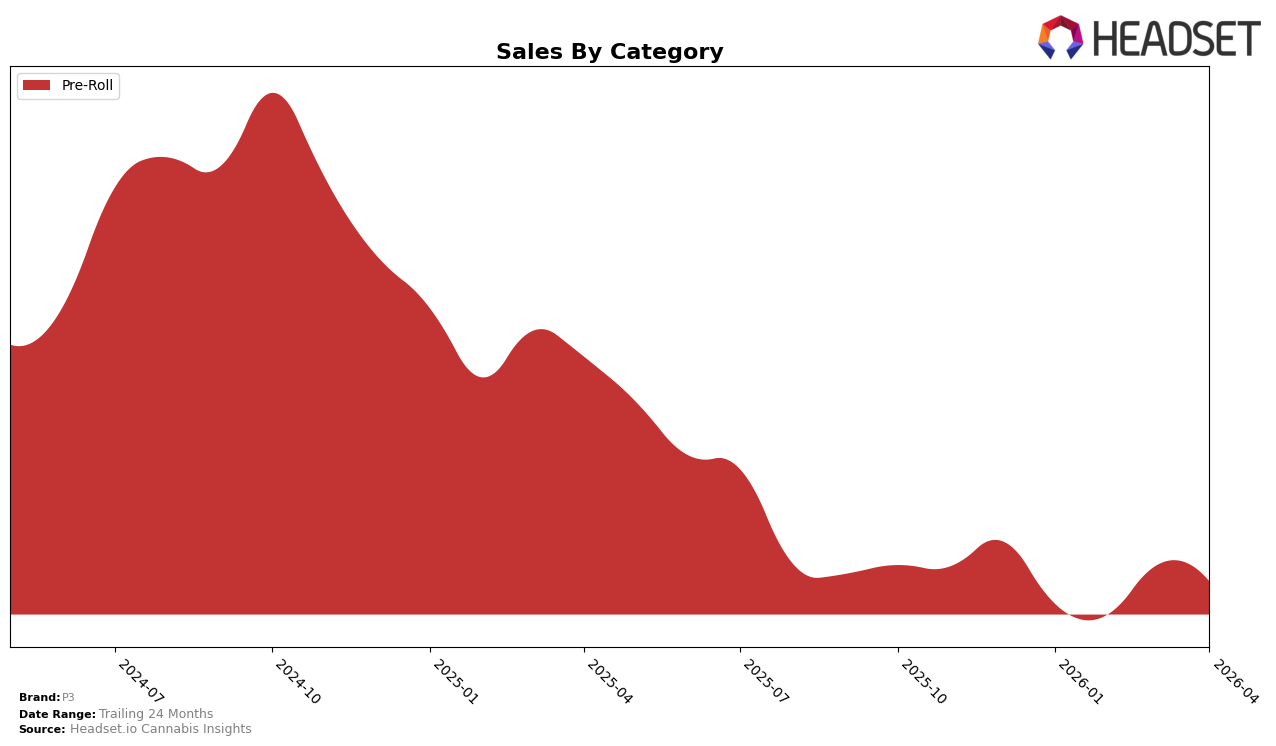
In the Colorado market, P3 has shown a notable performance within the Pre-Roll category over the early months of 2026. Starting the year at rank 25 in January, P3 improved its standing to reach 15th position by March, before slightly dipping to 20th in April. This fluctuation in ranking is reflective of the competitive dynamics within the state, yet P3 managed to achieve a significant sales spike in March, which indicates a strong consumer response to their offerings during that period. The ability to climb the rankings and maintain a presence within the top 30 demonstrates P3's resilience and potential for sustained growth in this category.
On the other hand, in Illinois, P3's presence in the Pre-Roll category appears to be more challenging. The brand did not secure a spot in the top 30 rankings for January and March, which suggests difficulties in gaining traction in this market. However, by February, P3 entered the rankings at position 67, indicating some level of market penetration, albeit outside the top 30. The absence from the top 30 in other months could be a signal of either strong competition or a need for strategic adjustments. These contrasting performances across states highlight the varying market conditions and consumer preferences that P3 must navigate to optimize its presence in different regions.
Competitive Landscape
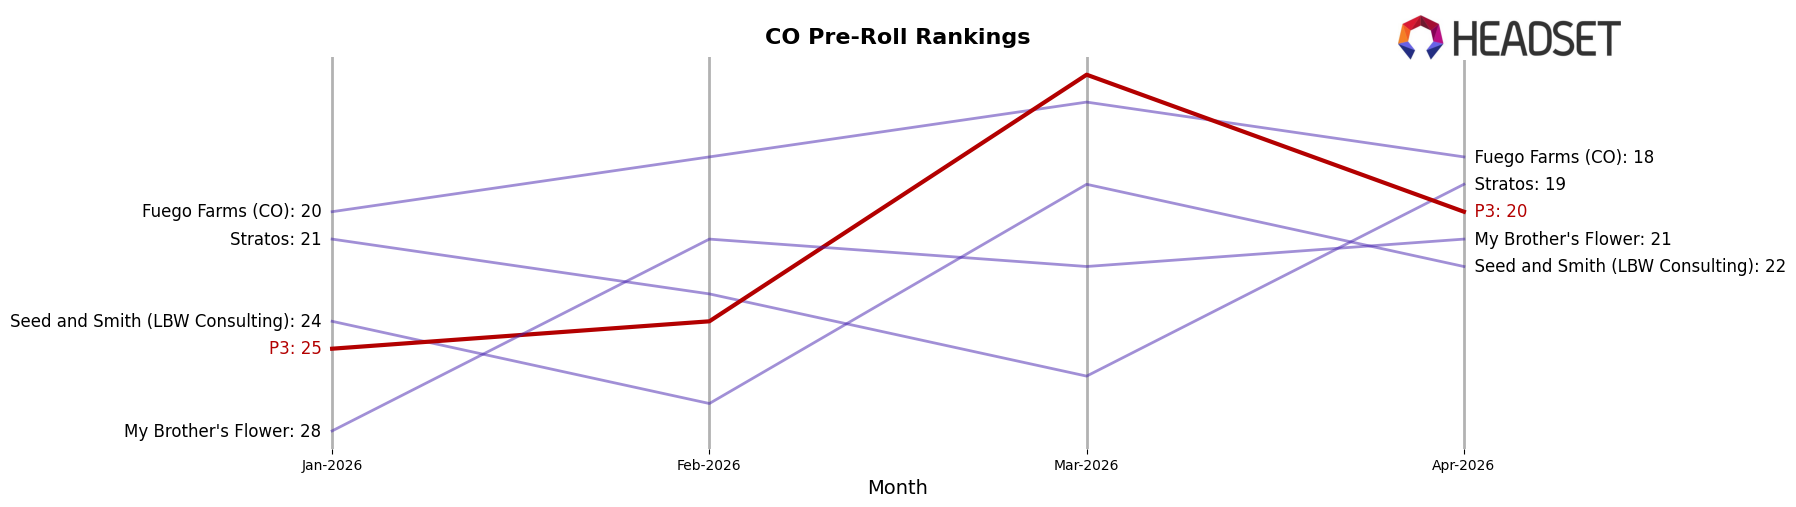
In the competitive landscape of the Colorado Pre-Roll category, P3 has demonstrated notable fluctuations in its market position, particularly between January and April 2026. P3's rank improved significantly in March, reaching the 15th position from 25th in January, indicating a strong performance surge. This improvement was short-lived, however, as P3's rank slipped to 20th in April. Despite this, P3's sales in March were impressive, surpassing those of Fuego Farms (CO) and Stratos, which were ranked 16th and 19th, respectively, in March. This suggests that while P3 experienced a temporary boost in sales, maintaining a consistent rank remains a challenge. The competitive pressure from brands like Seed and Smith (LBW Consulting) and My Brother's Flower, which also showed fluctuating ranks, highlights the dynamic nature of the market and the need for P3 to strategize effectively to sustain its sales momentum and improve its ranking consistently.
Notable Products
In April 2026, Sour Meltdown Infused Blunt (2g) reclaimed the top spot among P3's products, showing a strong recovery with sales reaching 1965 units. Choco Berry Chuck Infused Pre-Roll (1g) followed closely in second place, maintaining a steady upward trajectory from fourth in March with 1787 units sold. Loaded Banana Milkshake Infused Blunt (2g) remained consistent in third place, while Blueberry AK Limeade Infused Pre-Roll (1g) slipped slightly to fourth. Notably, Wilson's Mango Infused Pre-Roll (1g) entered the rankings at fifth place, marking its debut in the dataset. Overall, the month of April saw dynamic shifts in product rankings, underscoring the competitive nature of P3's offerings.
Top Selling Cannabis Brands
Data for this report comes from real-time sales reporting by participating cannabis retailers via their point-of-sale systems, which are linked up with Headset’s business intelligence software. Headset’s data is very reliable, as it comes digitally direct from our partner retailers. However, the potential does exist for misreporting in the instance of duplicates, incorrectly classified products, inaccurate entry of products into point-of-sale systems, or even simple human error at the point of purchase. Thus, there is a slight margin of error to consider. Brands listed on this page are ranked in the top twenty within the market and product category by total retail sales volume.

