.svg)


Where to Buy
Northern Lights FX is stocked at 52 licensed dispensaries across Michigan, with the deepest coverage in Lansing, Ann Arbor, Grand Rapids, Sturgis, and Adrian. Search by ZIP code or city below to find the closest one.
Market Insights Snapshot
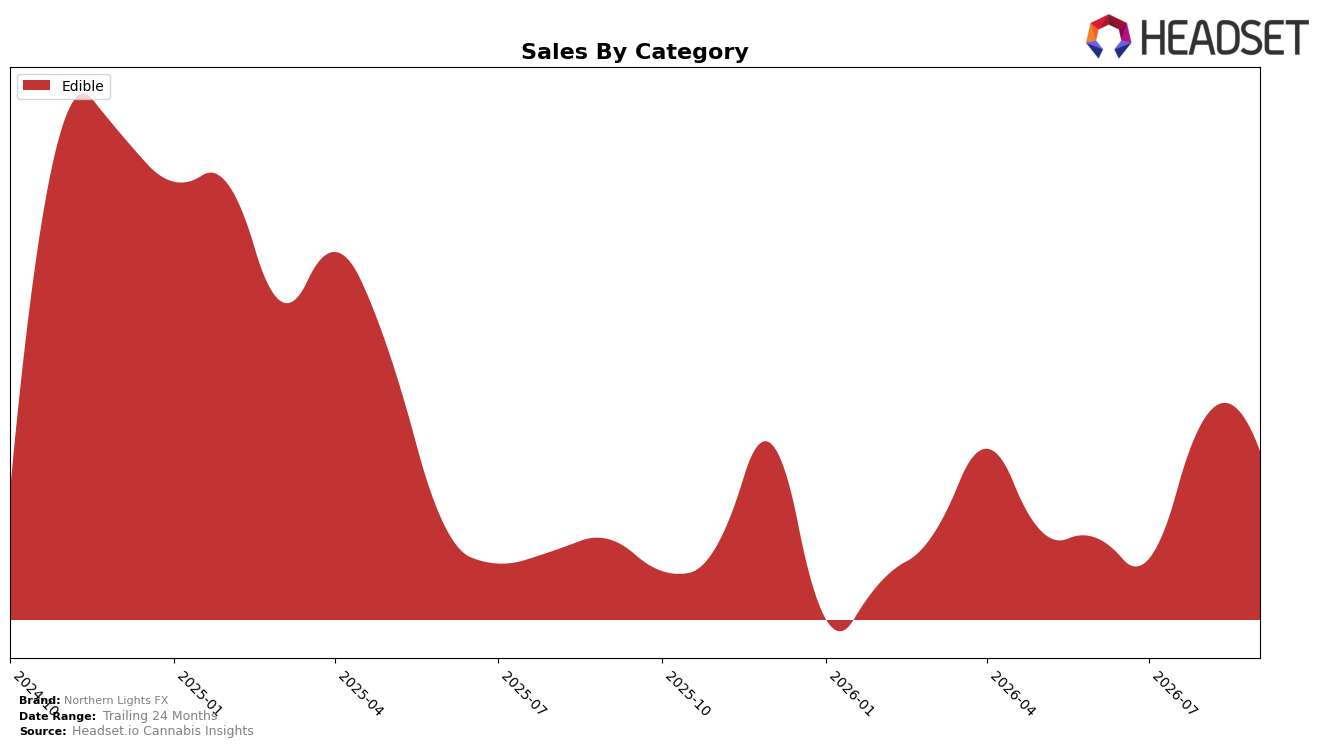
In September 2026, Northern Lights FX operated as a single-category Edible brand with 100.0% category share, posting year-over-year sales growth of 21.3% while month-over-month sales declined 6.1%. The brand’s average price fell 14.8% year-over-year alongside a 6.1% MoM revenue dip, indicating that the September pullback was volume- or mix-driven rather than price-led. Given a 24-month sales change of -2.4% versus a current-year increase of 21.3%, the recent rebound has not yet fully offset earlier contraction. The pattern implies a concentrated bet on Edibles that lifted annual momentum but left monthly volatility unbuffered due to zero diversification across categories.
Operating entirely in Edibles with a rank of 48 in Michigan sets a clear positioning signal: the brand trades reach for focus, using a 14.8% YoY price reduction to stimulate demand while accepting a 6.1% MoM dip as a tradeoff for single-category exposure. The combination of 21.3% YoY growth and -2.4% over 24 months suggests pricing can win share episodically but may not sustain rank without added formats or upsell tiers in Edibles. The implication is that maintaining a pure-Edible stance at rank 48 requires either continued price-led volume or a shift toward premium or multi-pack strategies to smooth the month-to-month swings visible in September.
Competitive Landscape
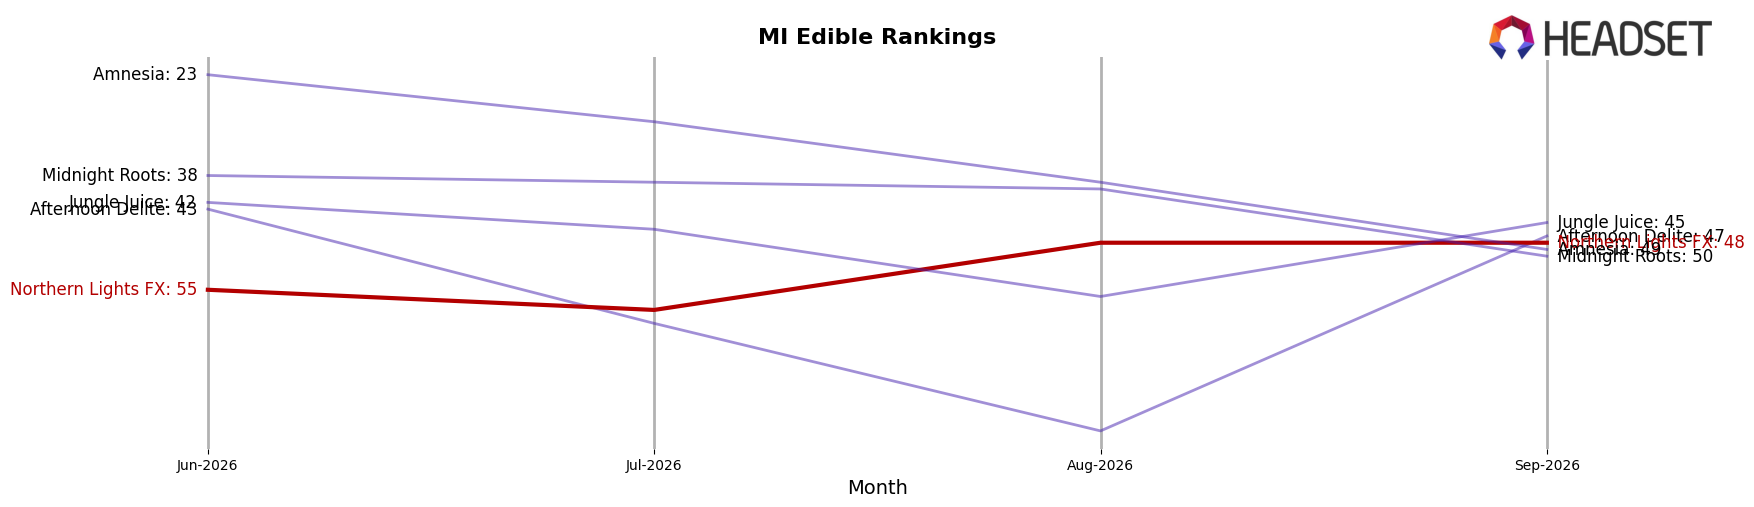
Northern Lights FX sits at rank #48 in MI Edible for September 2026, improving 9 positions from #57 year over year and 7 positions from #55 since June 2026, while still 8 spots below its peak at #40 from February 2025; meanwhile, category leaders show mixed momentum, with Wyld steady at #1 despite a -18.3% YoY sales change and Rocket (MI) climbing from #14 to #5 alongside a 65.2% YoY increase, indicating Northern Lights FX’s rank gains are incremental rather than breakout in a field where double-digit declines and surges coexist, which implies the brand’s trajectory points to gradual share recovery rather than rapid displacement of top-5 incumbents.
Notable Products
Mint Crunch Chocolate Bites 4-Pack (200mg) posted the standout move with a 58.2% month-over-month gain to rank 1, while Grape Cosmic Cluster Gummy (200mg) fell 74.4% and slid to rank 6. Sea Salt Pretzel Chocolate Bites 4-Pack (200mg) dropped 47.4% at rank 3 as S'mores Chocolate Bites 4-Pack (200mg) climbed 40.9% to rank 2, and six of the top ten are Chocolate Bites SKUs, indicating a consolidation around bite-size chocolate over gummies. This pattern implies Northern Lights FX is concentrating demand in chocolate bite formats and de-prioritizing gummy variants.
Top Selling Cannabis Brands






Data for this report comes from real-time sales reporting by participating cannabis retailers via their point-of-sale systems, which are linked up with Headset’s business intelligence software. Headset’s data is very reliable, as it comes digitally direct from our partner retailers. However, the potential does exist for misreporting in the instance of duplicates, incorrectly classified products, inaccurate entry of products into point-of-sale systems, or even simple human error at the point of purchase. Thus, there is a slight margin of error to consider. Brands listed on this page are ranked in the top twenty within the market and product category by total retail sales volume.

