.svg)
Aug-2026
Sales
Trend
6-Month
Product Count
SKUs
Avg Price
YoY Sales Change
YoY Price Change


Where to Buy
Rocket (MI) is stocked at 240 licensed dispensaries across Michigan, with the deepest coverage in New Buffalo, Detroit, Grand Rapids, Monroe, and Flint. Search by ZIP code or city below to find the closest one, or filter by product type if you are after a specific format.
Market Insights Snapshot
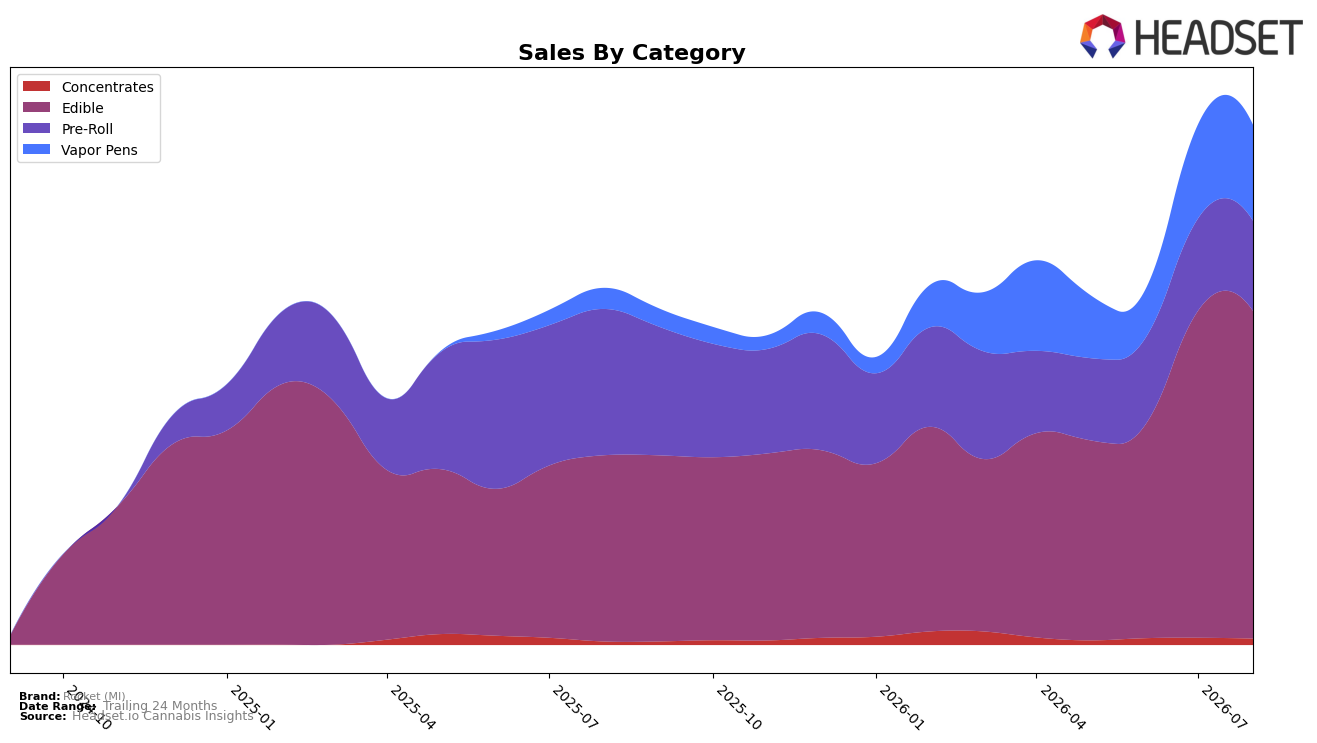
Edible holds 63.04% share in August 2026 with 75.67% year-over-year growth but a 0.12% month-over-month dip, while Vapor Pens accounts for 18.43% share on 358.79% year-over-year growth and a 1.57% month-over-month increase; together these two now comprise 81.47% of mix versus Pre-Roll at 17.34% share with a 38.45% year-over-year decline and a 2.40% month-over-month decline. Concentrates remains a 1.19% sliver despite 89.57% year-over-year growth and an 11.56% month-over-month decline, and the overall average price fell 11.78% year-over-year even as brand sales rose 45.56% year-over-year; in Michigan Edible sits at rank 7. The pattern implies Rocket (MI) is re-weighting demand toward Edible and Vapor Pens while ceding Pre-Roll velocity, with pricing deflation aiding volume gains but concentrating risk in two categories.
With Edible slipping 0.12% month-over-month while Vapor Pens grew 1.57% month-over-month, the near-term momentum tilts toward inhalables even as Edible anchors the base at 63.04% share and rank 7 in Michigan; the 38.45% year-over-year contraction in Pre-Roll paired with a 2.40% month-over-month drop suggests continued de-prioritization. Concentrates’ 89.57% year-over-year increase from a 1.19% base, alongside a 11.56% month-over-month pullback and the brand’s 11.78% year-over-year price reduction, implies an entry-price and value-led positioning that leans into Edible scale and Vapor Pen acceleration while trimming exposure to low-yield Pre-Rolls.
Competitive Landscape
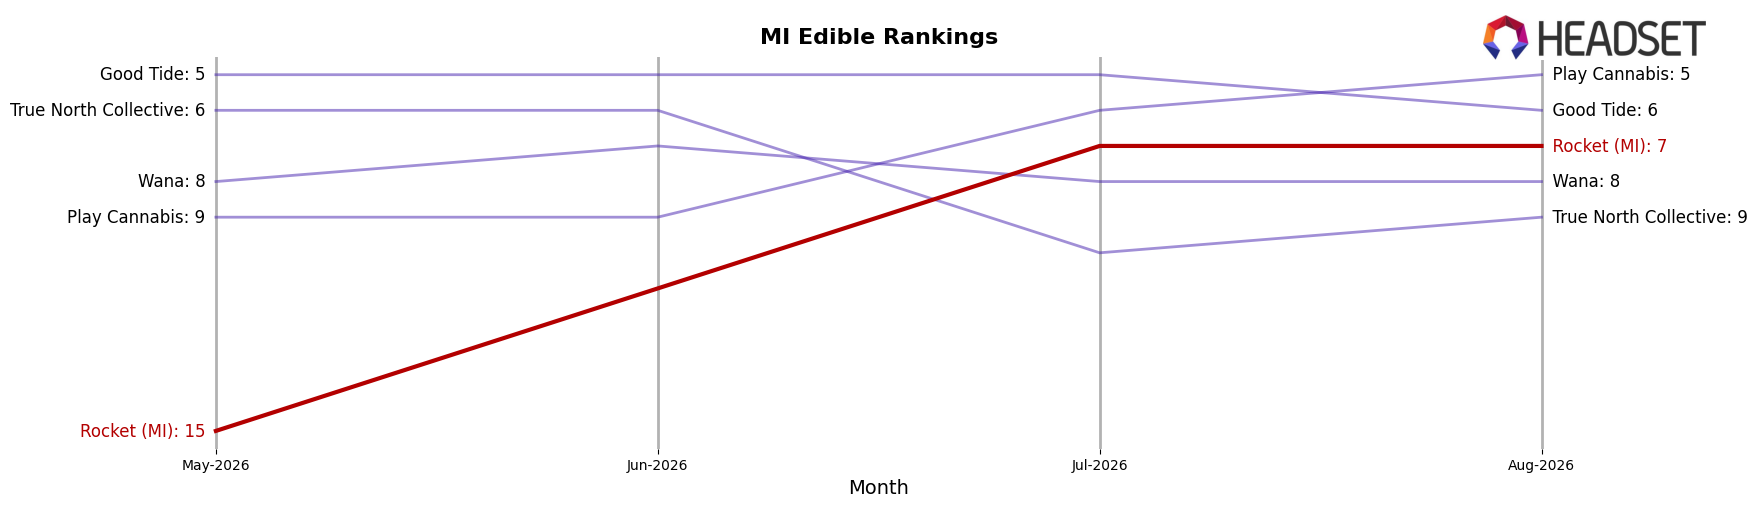
Rocket (MI) sits at rank #7 in MI Edible for August 2026, up 10 positions from #17 year over year, and up 8 spots from #15 in May 2026; this ascent coincides with category leaders shifting as Wyld held #1 while posting a -22.9% YoY sales change and Play Cannabis climbed from #11 to #5 with +22.8% YoY growth. Against mid-tier movements, MKX Oil Company slipped from #3 to #4 despite a +0.3% YoY sales change, while Camino advanced from #4 to #3 with +22.2% YoY, placing Rocket (MI)’s jump to its peak rank #7 in August 2026 as evidence of share capture from declining incumbents and acceleration versus slower-moving peers.
Notable Products
Cotton Candy Clouds Gummies 10-Pack (200mg) posted the standout movement in August 2026 with a -56.7% month-over-month drop while still holding rank 1, indicating a sharp pullback at the very top as Atomic Cherry Gummies 10-Pack (200mg) at rank 2 slid a milder -5.9%. Blazing Starfruit Gummies 10-Pack (200mg) and Mighty Melon Gummies 10-Pack (200mg) rose +6.9% and +7.3% respectively but remained outside the top-3 at ranks 4 and 6, while Strawberry Supernova Gummies 10-Pack (200mg) dipped -1.3% at rank 3; eight of the top ten SKUs are Edibles, concentrating the portfolio in a single format. The only non-Edibles, Sour Green Apple Infused Pre-Roll (1.2g) at rank 9 and Grape Soda Infused Pre-Roll (1.2g) at rank 10, slipped -1.0% and -3.1% with comparatively lower scale at $45,666, suggesting limited offset from Pre-Rolls as Edible volatility grows. The pattern implies Rocket (MI) is leaning hard into Edibles with high exposure to top-SKU swings, signaling a need to broaden mix or stabilize flagship demand to protect rank leadership.
Top Selling Cannabis Brands






Data for this report comes from real-time sales reporting by participating cannabis retailers via their point-of-sale systems, which are linked up with Headset’s business intelligence software. Headset’s data is very reliable, as it comes digitally direct from our partner retailers. However, the potential does exist for misreporting in the instance of duplicates, incorrectly classified products, inaccurate entry of products into point-of-sale systems, or even simple human error at the point of purchase. Thus, there is a slight margin of error to consider. Brands listed on this page are ranked in the top twenty within the market and product category by total retail sales volume.

