Jun-2026
Sales
Trend
6-Month
Product Count
SKUs
Avg Price
YoY Sales Change
YoY Price Change
Market Insights Snapshot
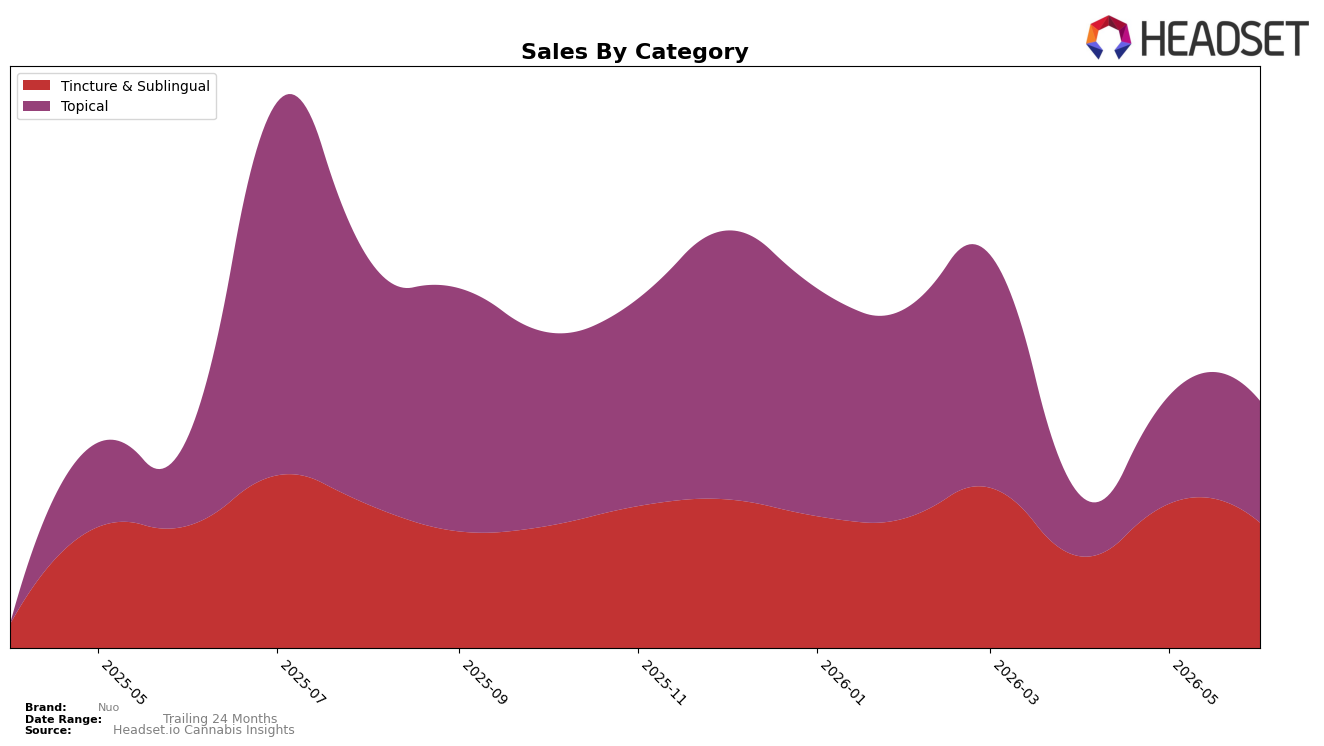
Nuo’s mix in June 2026 split nearly evenly between Tincture & Sublingual at 50.49% share and Topical at 49.51% share, but the trajectories diverged: Tincture & Sublingual was up 1.44% year over year while down 8.86% month over month, whereas Topical rose 19.31% year over year and 7.80% month over month. Average prices moved in opposite directions across the portfolio, with brand-level pricing down 4.06% year over year alongside a category gap where Tincture & Sublingual averaged $22.43 and Topical averaged $42.21. The pattern implies mix is tilting toward higher-priced Topicals on a growth path while Tincture & Sublingual provides volume stability but is soft intra-month, creating a near-term margin uplift opportunity if the Topical momentum persists.
With Tincture & Sublingual holding a rank of 4 in Colorado and a 1.44% year-over-year gain but an 8.86% month-over-month dip, Nuo’s core placement supports visibility even as short-term velocity cools; conversely, Topical’s 19.31% year-over-year and 7.80% month-over-month growth suggests share capture potential that can offset seasonal softness in drops. The brand’s 9.56% year-over-year sales increase alongside a 4.06% price decrease indicates volume-led expansion, and the near 1:1 split between 50.49% and 49.51% shares gives headroom to lean into Topical without overexposing to one format. The implication is a barbell positioning: protect fourth-place credibility in Tincture & Sublingual while reallocating promotional weight to sustain Topical’s higher ticket growth to stabilize margins and smooth month-to-month volatility.
Competitive Landscape
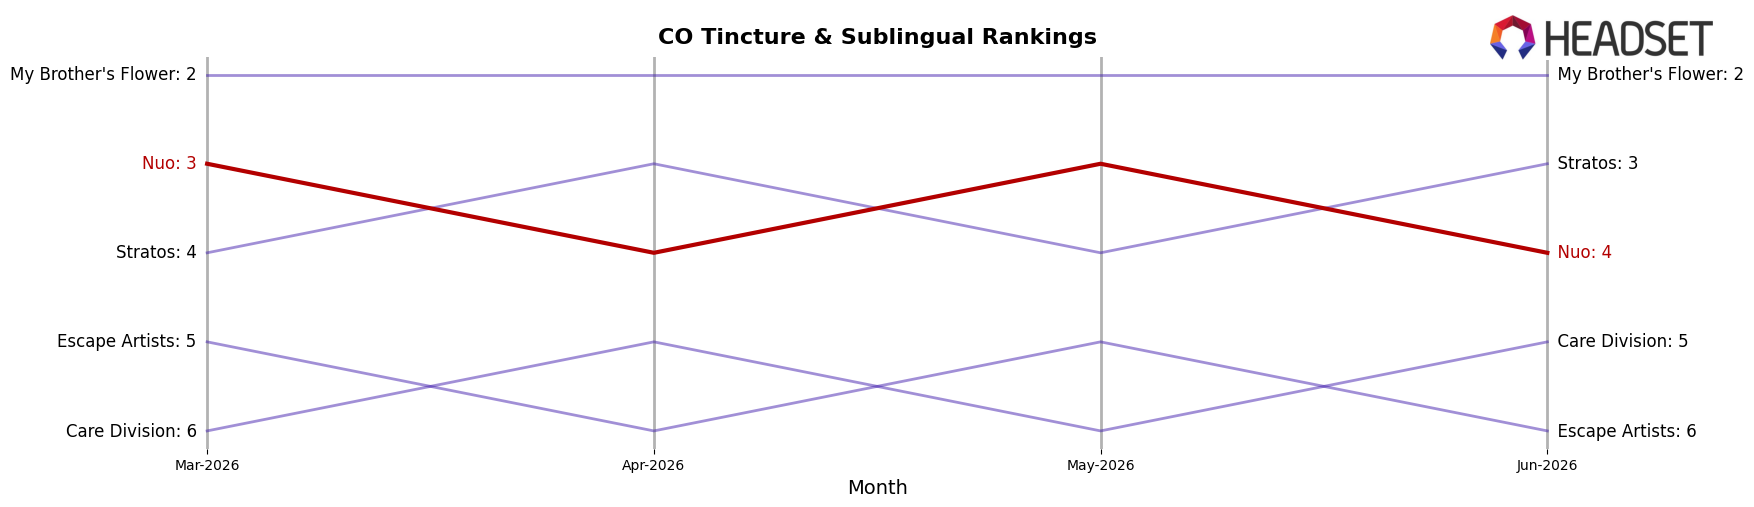
Nuo sits at rank #4 in Colorado Tincture & Sublingual for June 2026, improving 1 position from #5 year over year, but slipping 1 spot from #3 in March 2026 after peaking at #3 in May 2026; in the same period, Stratos climbed from #6 to #3 with a 14.7% YoY sales increase while Ripple (formerly Stillwater Brands) held #1 despite a 42.5% YoY decline and My Brother's Flower remained at #2 with a 33.2% YoY drop; this mix of upward and downward moves suggests Nuo’s slight rank gain is driven less by market contraction at the top and more by proximity pressure from a faster-rising #3, implying that holding share will require countering momentum from below rather than relying on leader attrition.
Notable Products
CBD/THC 1:1 Lavender Cream (1000mg CBD, 1000mg THC) posted the largest movement in June 2026 with a 75.8% month-over-month jump and climbed to rank 3, while the top-ranked CBD/THC 20:1 Relief Tincture (2000mg CBD, 100mg THC) slipped 4.2% MoM and held rank 1. In contrast, CBD/CBN/THC 5:1:1 Sleep Tincture (500mg CBD, 100mg CBN, 100mg THC) fell 18.3% MoM at rank 2, and the CBD/THC 1:1 Unscented Cream (1000mg CBD, 1000mg THC) dropped 38.2% MoM at rank 5, signaling divergent momentum within adjacent formats. With three Topical SKUs occupying ranks 3–5 and two Tincture & Sublingual SKUs in the top two, the mix implies Nuo is tilting toward topical-led growth as demand consolidates around 1:1 relief formats while higher-ratio tinctures face softening.
Top Selling Cannabis Brands
Data for this report comes from real-time sales reporting by participating cannabis retailers via their point-of-sale systems, which are linked up with Headset’s business intelligence software. Headset’s data is very reliable, as it comes digitally direct from our partner retailers. However, the potential does exist for misreporting in the instance of duplicates, incorrectly classified products, inaccurate entry of products into point-of-sale systems, or even simple human error at the point of purchase. Thus, there is a slight margin of error to consider. Brands listed on this page are ranked in the top twenty within the market and product category by total retail sales volume.

