Jun-2026
Sales
Trend
6-Month
Product Count
SKUs
Avg Price
YoY Sales Change
YoY Price Change
Market Insights Snapshot
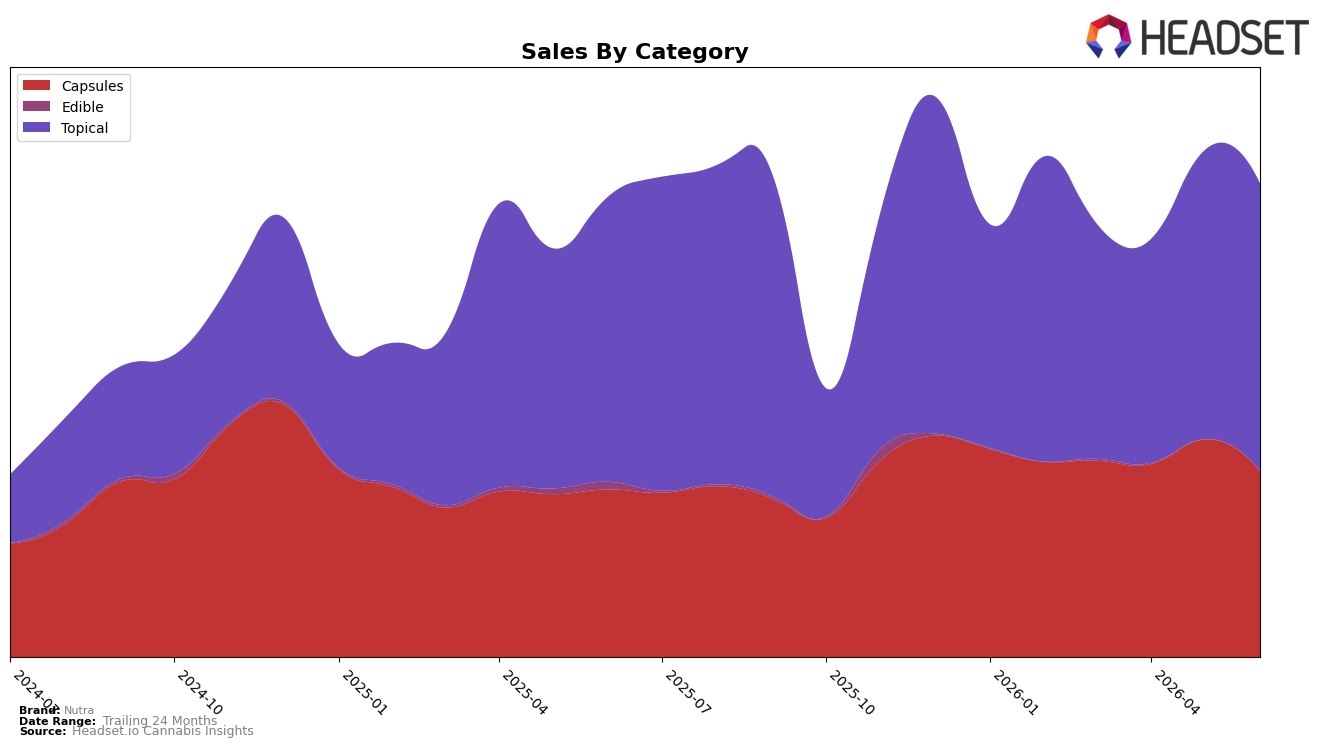
Nutra’s category mix in June 2026 is split between Topical at 60.69% share and Capsules at 39.31% share, with Topical up 0.76% year over year but down 0.48% month over month, and Capsules up 10.98% year over year but down 14.54% month over month. Despite a brand-level year-over-year sales increase of 2.88% and an average price up 1.14%, the sharper month-over-month contraction in Capsules versus the milder decline in Topical indicates that recent momentum has tilted toward maintaining Topical’s base rather than expanding Capsules’ contribution, implying short-term sensitivity to intra-quarter demand swings even as the longer 24-month growth of 268.02% sets a higher baseline.
Positioning-wise, holding a 60.69% Topical share while ranking 3rd in Topical in British Columbia suggests Nutra is anchored in a lead category where modest 0.76% year-over-year growth and a 0.48% month-over-month dip can be buffered by pricing near $41.61. The 10.98% year-over-year growth in Capsules paired with a 14.54% month-over-month decline signals a volatile secondary pillar that can elevate rank when demand expands but can also compress overall share if replenishment or promo cadence lags, implying Nutra’s positioning benefits from stabilizing Capsules seasonality while using Topical’s scale to preserve rank consistency.
Competitive Landscape
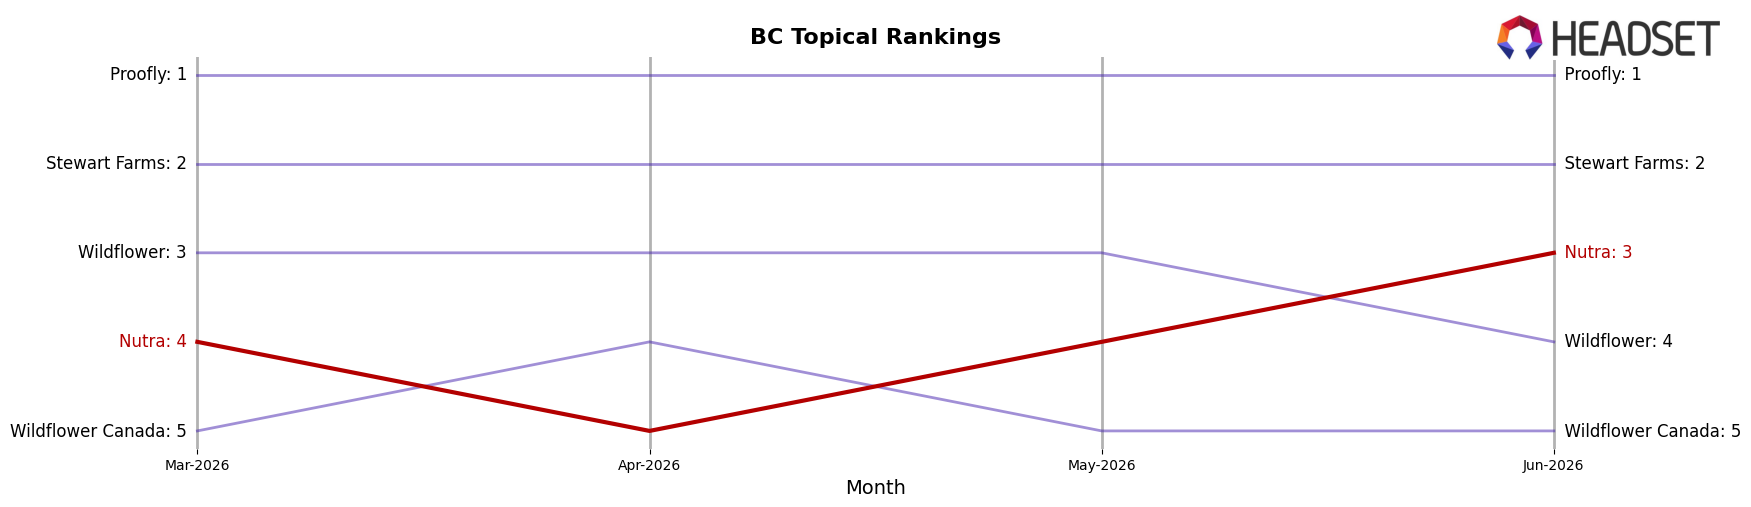
Nutra ranks #3 in BC Topical in June 2026, improving 1 position year over year from #4, and rising 1 rank since March 2026 when it sat at #4; in the same period Stewart Farms advanced from #3 to #2 with a 13.41% YoY sales increase while Wildflower Canada slid from #2 to #5 alongside a -64.88% YoY sales change. Against the category leader, Proofly held #1 with a 15.49% YoY sales lift, whereas Wildflower climbed from #5 to #4 with 276.17% YoY growth, indicating pressure from below as Nutra hits its peak rank of #3 in June 2026. The pattern implies Nutra’s modest upward rank trajectory is driven more by competitor reshuffling than outpacing the fastest growers, so maintaining #3 will require defending against challengers closing the gap while chasing the stable leader.
Notable Products
CBD/CBG 24k Gold Magnesium + Hyaluronic Acid Transdermal Spray (500mg CBD, 50mg CBG, 60ml) delivered the largest month-over-month surge at +118.3% to rank 10, while CBD/CBG 5:1 Harmony Blend Relief Stick (1000mg CBD, 200mg CBG) also jumped +61.8% at rank 3, indicating Topical innovation is pulling up the tail and mid-pack simultaneously. Against those gains, CBD/CBG 5:1 Sunbeam Capsules 30-Pack (3000mg CBD, 600mg CBG) plunged -69.7% at rank 6 and CBN Plant Based Capsules 60-Pack (900mg CBN) fell -34.9% at rank 7, even as CBD Isolate Capsules 60-Pack (6000mg CBD) rose +17.3% at rank 4, signaling consumer preference shifting toward simpler CBD-led formats over niche minor-cannabinoid blends. Four of the top ten are Capsules while three are Topicals, and the category mix contrasts a -13.2% dip for CBG Isolate Capsules 30-Pack (900mg CBG) at rank 9 with a -6.2% slide in the flagship CBD Peppermint Lavender + MAG + Hyaluronic Acid Balm (3000mg CBD) at rank 1 and a -2.7% move for CBD Hemp Isolate Capsules 30-Pack (3000mg CBD) at rank 2, which implies Nutra’s commercial direction is tilting toward Topicals as launch vehicles while consolidating Capsules around CBD-forward SKUs and de-emphasizing CBG/CBN-heavy variants.
Top Selling Cannabis Brands
Data for this report comes from real-time sales reporting by participating cannabis retailers via their point-of-sale systems, which are linked up with Headset’s business intelligence software. Headset’s data is very reliable, as it comes digitally direct from our partner retailers. However, the potential does exist for misreporting in the instance of duplicates, incorrectly classified products, inaccurate entry of products into point-of-sale systems, or even simple human error at the point of purchase. Thus, there is a slight margin of error to consider. Brands listed on this page are ranked in the top twenty within the market and product category by total retail sales volume.

