.svg)

Aug-2026
Sales
Trend
6-Month
Product Count
SKUs
Avg Price
YoY Sales Change
YoY Price Change


Where to Buy
OGEEZ is stocked at 446 licensed dispensaries across New Jersey, Washington, and 3 other states, 118 of them in New Jersey, with the deepest coverage in Franklin Township, Union, Atlantic City, Bloomfield, and Eatontown. Search by ZIP code or city below to find the closest one, or filter by product type if you are after a specific format.
Market Insights Snapshot
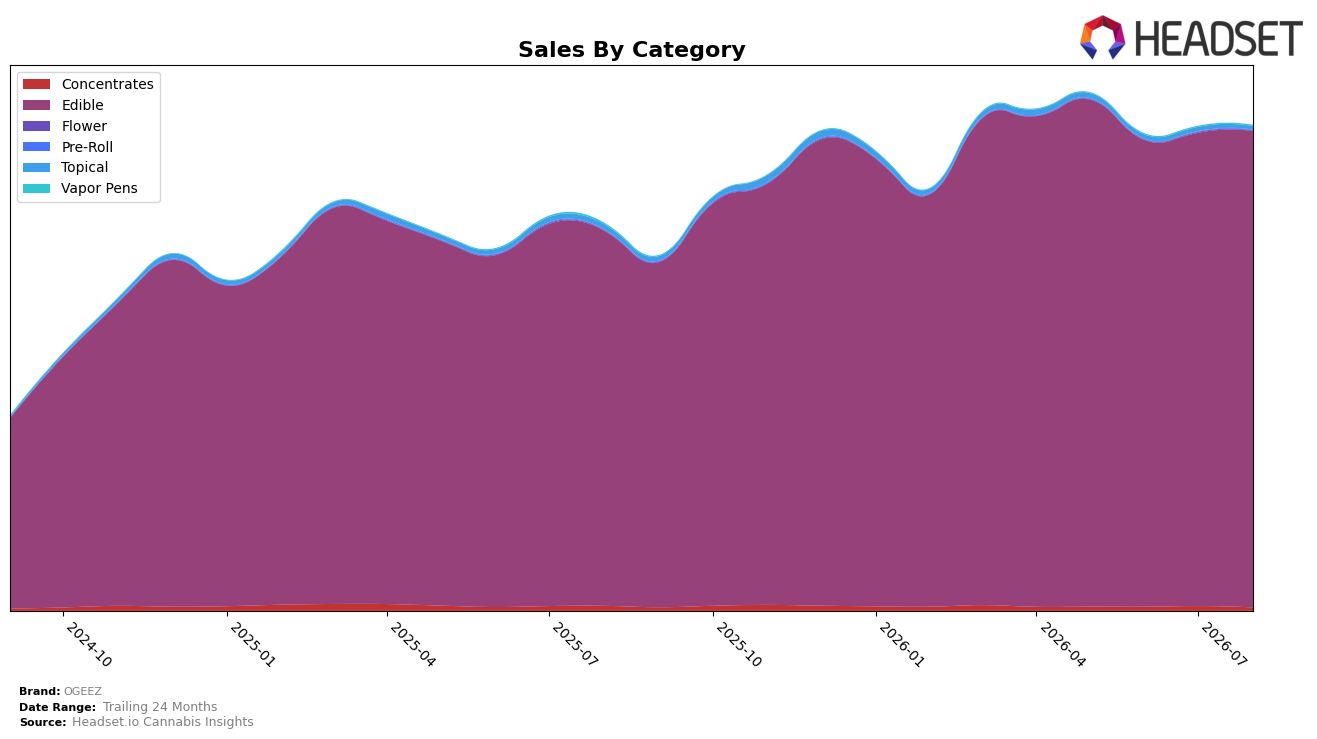
In August 2026, OGEEZ concentrated 98.52% of sales in Edible, where sales grew 27.01% year over year and 0.64% month over month, while the overall brand posted 25.36% year-over-year growth and an average price decline of 11.11%. Peripheral categories contracted: Concentrates fell 34.69% YoY and 31.40% MoM with just 0.62% share, and Topical declined 34.89% YoY and 21.18% MoM at 0.62% share; meanwhile, Pre-Roll expanded 79.84% YoY and 25.56% MoM despite only 0.06% share. Vapor Pens dipped 28.30% YoY but rose 9.87% MoM, holding 0.16% share, while Flower shrank 40.18% YoY and 59.63% MoM at 0.04% share. With Edible anchoring volume and smaller formats either contracting or too small to offset mix, the pattern implies OGEEZ is doubling down on Edible scale while using selective tests in Pre-Roll and Vapor Pens to probe incremental reach.
OGEEZ’s positioning is centered on Edible dominance at a 98.52% mix, which aligns with an August 2026 category rank of 2 in Edible in Arizona, while price strategy shifts—average price at $12.04 alongside an 11.11% YoY price decrease—suggest volume-led share defense rather than premium trade-up. The outsized YoY lift in Pre-Roll at 79.84% and MoM gain of 25.56%, paired with a 9.87% MoM uptick in Vapor Pens, indicates early-stage assortment diversification without material dilution of the Edible focus. This mix—Edible growth outpacing brand-level YoY by 1.65 points and lagging only marginally on MoM against faster-moving but tiny formats—implies OGEEZ is optimizing for share stability in its core while using low-risk extensions to test adjacency traction.
Competitive Landscape
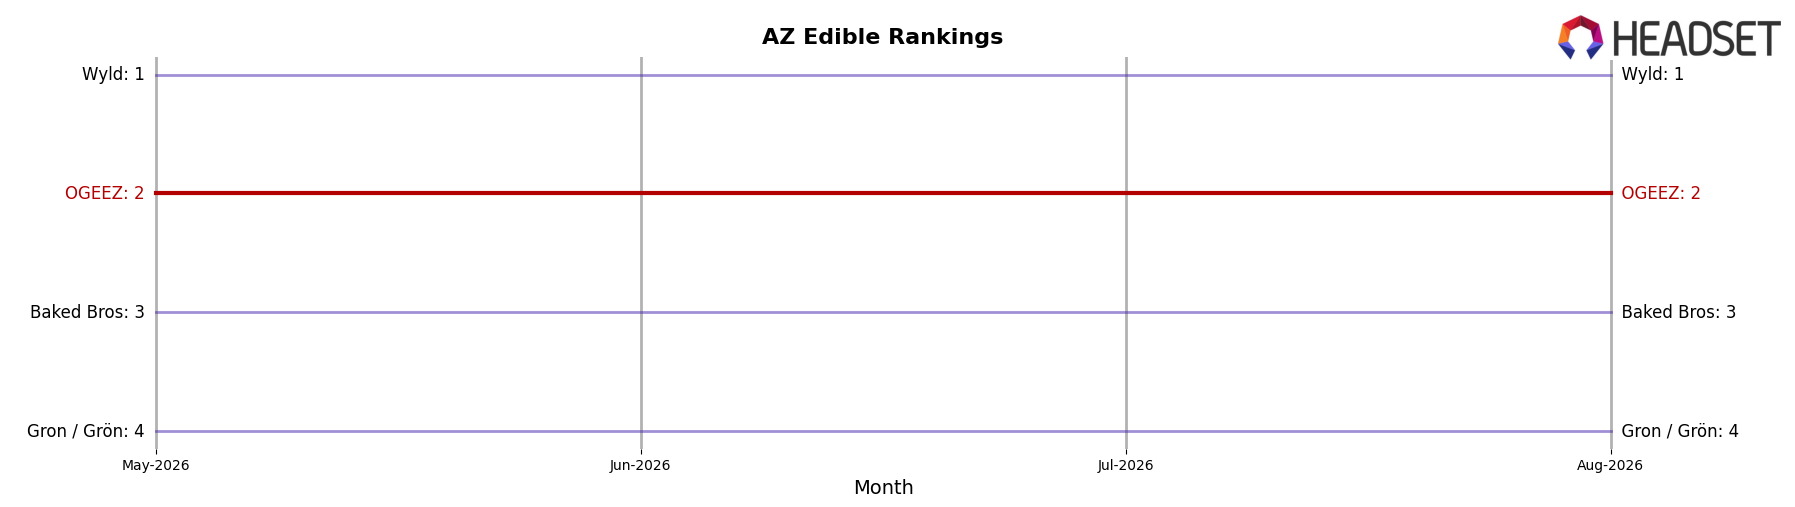
OGEEZ is ranked #2 in AZ Edible in August 2026, unchanged from #2 in August 2025, and it also held #2 three months ago, indicating zero rank movement across both the year and recent quarter; meanwhile, category leader Wyld stayed at #1 year over year while posting a 19.2% YoY sales decline, and Baked Bros remained at #3 with a 9.5% YoY sales increase, tightening pressure from below. With Gron / Grön holding #4 alongside a 2.5% YoY lift and Wana steady at #5 with an 8.2% YoY gain, the upward momentum from ranks #3–#5 contrasts with static positions at #1 and #2; the pattern implies OGEEZ’s stable #2 rank is sustained by a softening leader above and faster-growing challengers below, signaling a near-term risk of compression unless share expands.
Notable Products
Big Peg's Raspberry Orange RSO Gummy (100mg) posted the largest MoM gain in August 2026 at +29.8%, climbing to rank 3 while the Sleep - THC/CBN 2:1 Indica Aqua Berry Gummy (100mg THC, 50mg CBN) slid -3.9% but held rank 1. Peg's Big - Pink Lemonade RSO Gummies 10-Pack (100mg) advanced +12.7% to rank 2, whereas The Creams - Mellow Indica Gummies 10-Pack (100mg) declined -11.6% and sat at rank 9. Eight of the top ten are Edible gummies, and five SKUs within the Peg’s/Big family occupy ranks 2–5 with MoM changes ranging from -4.6% to +29.8%, indicating a concentration of demand into RSO-led and functional formulations. The mix points to OGEEZ leaning into RSO and sleep/ratio formats as the commercial center of gravity, with incremental gains in classic fruit and creams lines supporting breadth without displacing the top functional SKUs.
Top Selling Cannabis Brands






Data for this report comes from real-time sales reporting by participating cannabis retailers via their point-of-sale systems, which are linked up with Headset’s business intelligence software. Headset’s data is very reliable, as it comes digitally direct from our partner retailers. However, the potential does exist for misreporting in the instance of duplicates, incorrectly classified products, inaccurate entry of products into point-of-sale systems, or even simple human error at the point of purchase. Thus, there is a slight margin of error to consider. Brands listed on this page are ranked in the top twenty within the market and product category by total retail sales volume.

