.svg)

Sep-2026
Sales
Trend
6-Month
Product Count
SKUs
Avg Price
YoY Sales Change
YoY Price Change


Where to Buy
Baked Bros is stocked at 85 licensed dispensaries across Arizona, with the deepest coverage in Phoenix, Tucson, Mesa, Tempe, and Chandler. Search by ZIP code or city below to find the closest one, or filter by product type if you are after a specific format.
Market Insights Snapshot
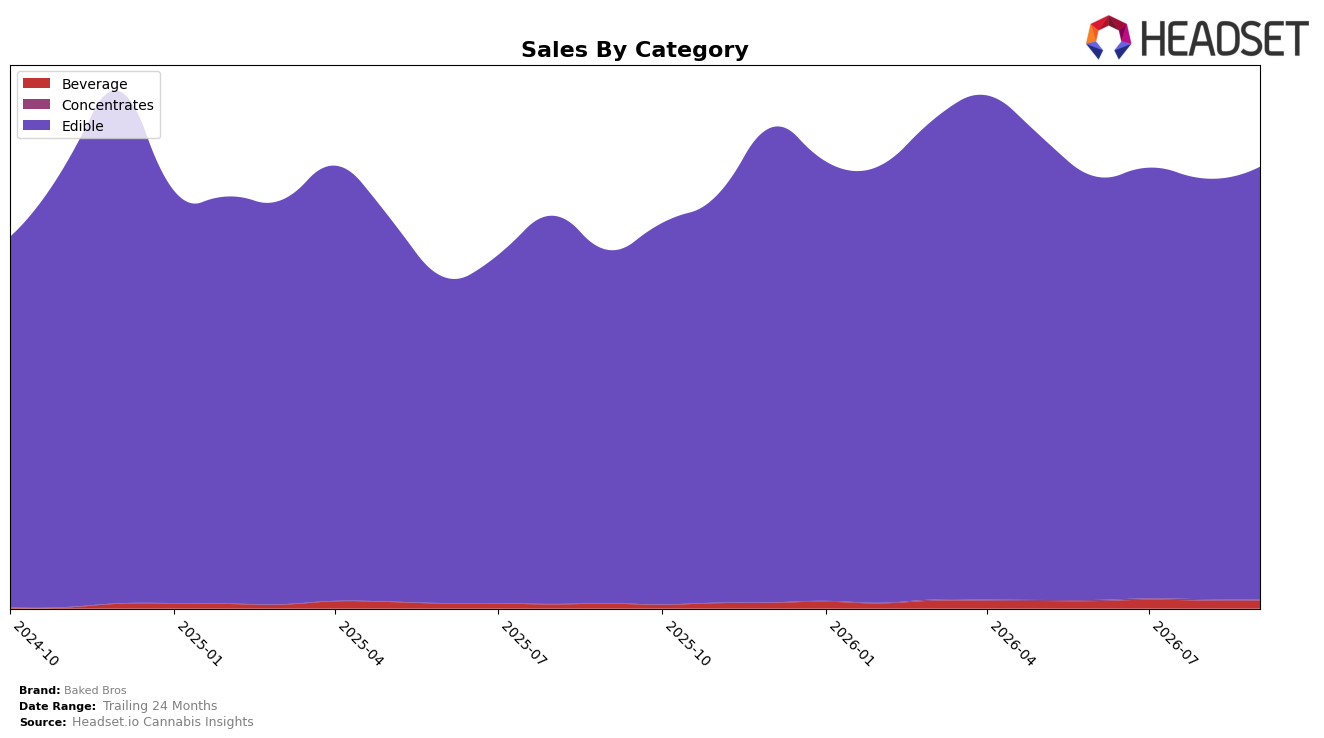
In September 2026, Baked Bros remained overwhelmingly concentrated in Edible, with a 98.09% share and month-over-month growth of 2.82% alongside year-over-year growth of 22.48%, while Beverage held 1.74% share with a 70.55% year-over-year increase but a -0.19% month-over-month dip. Concentrates stayed marginal at 0.17% share with a -10.16% month-over-month change and no year-over-year baseline, and the brand’s average price fell 7.89% year over year as overall brand sales rose 23.29% year over year. This pattern implies Baked Bros is driving volume-led gains within Edible rather than diversifying materially, using price to accelerate unit throughput while smaller categories contribute incrementally without changing the core mix.
Positioning-wise, a 98.09% Edible share combined with a rank of 2 in Edible within Arizona suggests the brand is competing as a scale player in a single category, trading price (−7.89% YoY) for broader reach and sustained sales growth (+23.29% YoY). With Beverage up 70.55% year over year but still under 2% share and Concentrates declining month over month by 10.16%, the brand is signaling focus rather than portfolio balance, which implies defensibility in Edible but limited hedge against category swings.
Competitive Landscape
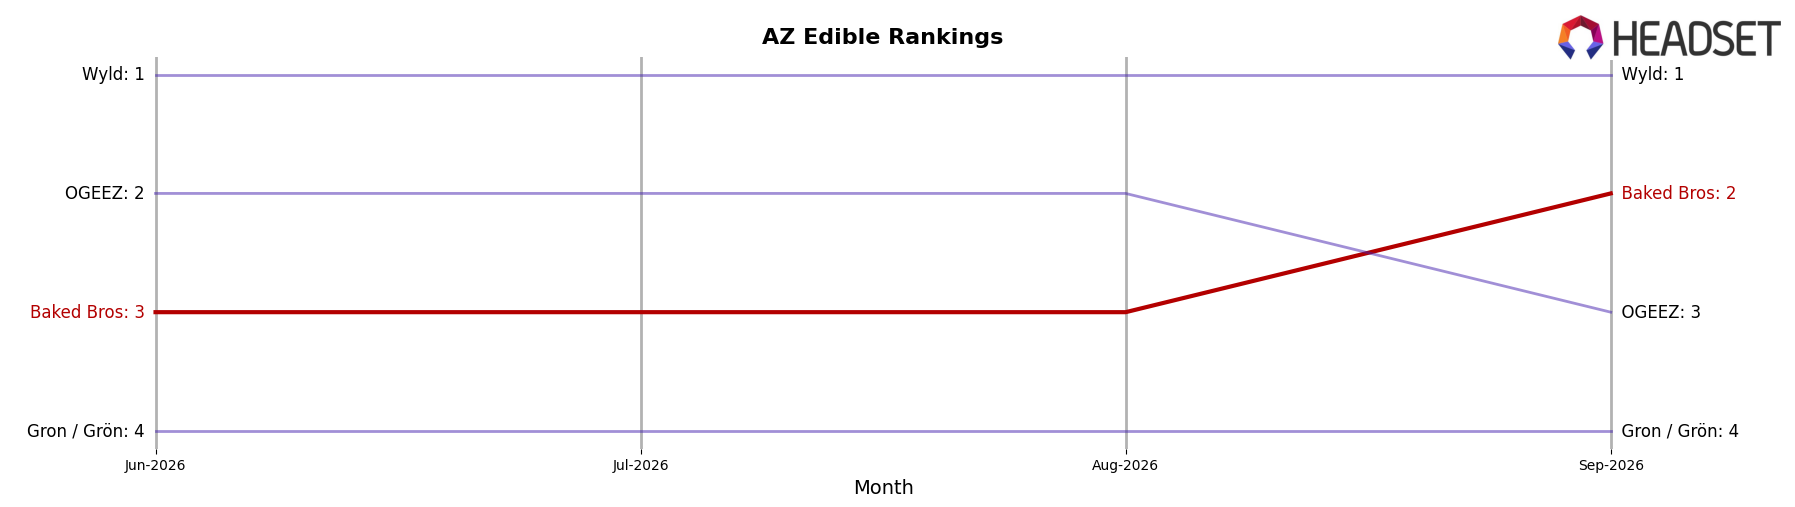
Baked Bros is ranked #2 in AZ Edible in September 2026, up 2 positions from #4 year over year, and up 1 spot from #3 in June 2026, while holding its peak-to-date at #2 in September 2026; meanwhile, Wyld held at #1 year over year but posted a -16.2% sales change, and OGEEZ slipped from #2 to #3 with a -8.0% sales change, indicating Baked Bros gained relative standing as higher-ranked rivals contracted. With Gron / Grön easing from #3 to #4 on a -4.8% sales change and Wana static at #5 despite +14.4% sales growth, Baked Bros’ upward rank movement alongside competitor declines suggests share consolidation at the top rather than category-wide expansion, implying the brand’s trajectory is driven by outpacing incumbents rather than absolute market lift.
Notable Products
Dreamy - CBN/THC 5:2 Elderberry Plum Gummies 10-Pack (250mg CBN, 100mg THC) posted the standout move in September 2026 with a 19.5% month-over-month increase while holding rank 5, contrasted against slight declines of -5.8% and -5.6% at ranks 7 and 7 for Wild Strawberry Live Hash Rosin Gummies 10-Pack (100mg) and Arizona Punch Live Hash Rosin Gummies 10-Pack (100mg). Sleepy - CBD/THC 2:1 Blackberry Acai x Granddaddy Purple Gummies 10-Pack (200mg CBD, 100mg THC) edged up 5.1% to remain rank 1 as Happy - CBD/CBC/THC 1:1:1 Jack Herer Pomegranate Nectarine Gummies 10-Pack (100mg CBD, 100mg CBC, 100mg THC) rose 6.5% at rank 2, signaling gains concentrated at the top two positions rather than broad category lift. With nine of the top ten SKUs in Edible gummies and only one SKU near the bottom showing a sub -6% decline, the mix points to Baked Bros doubling down on minor-cannabinoid formulations where rank 1–2 stability coexists with selective retreat in live rosin flavors.
Top Selling Cannabis Brands






Data for this report comes from real-time sales reporting by participating cannabis retailers via their point-of-sale systems, which are linked up with Headset’s business intelligence software. Headset’s data is very reliable, as it comes digitally direct from our partner retailers. However, the potential does exist for misreporting in the instance of duplicates, incorrectly classified products, inaccurate entry of products into point-of-sale systems, or even simple human error at the point of purchase. Thus, there is a slight margin of error to consider. Brands listed on this page are ranked in the top twenty within the market and product category by total retail sales volume.

