Market Insights Snapshot
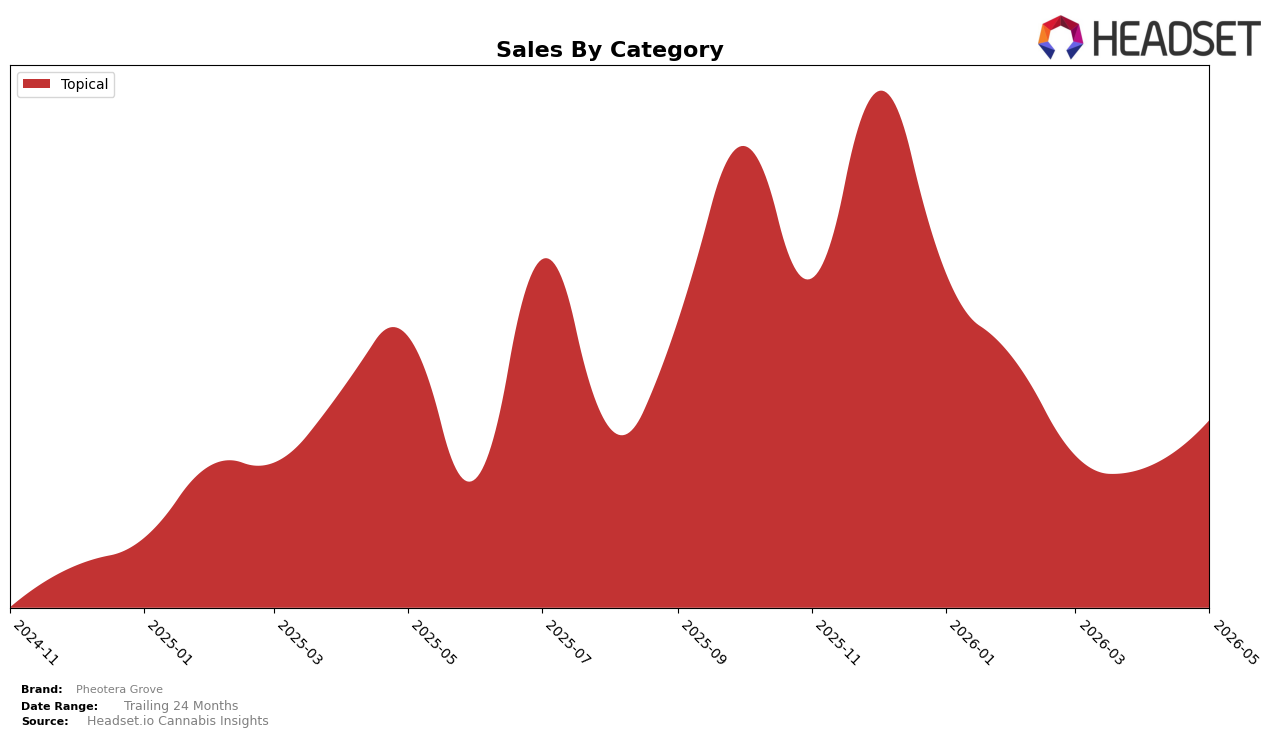
In May 2026, Pheotera Grove operated as a single-category brand with Topical accounting for 100.0% category share, pairing a year-over-year sales change of -27.6% with a month-over-month lift of 28.0%. Despite an average price increase of 12.0% year over year to $29.43, the Topical line's sales contraction on a yearly basis contrasts with its monthly rebound, indicating a price-led mix within a fully concentrated portfolio. With rank data in Illinois unavailable and the Topical share fixed at 100.0%, the combination of -27.6% YoY and +28.0% MoM signals volatility concentrated in a single lane rather than diversification smoothing effects; the pattern implies the brand is trading short-term demand elasticity for a focused, higher-priced Topical identity.
The simultaneous 12.0% YoY price increase and -27.6% YoY sales decline, alongside a +28.0% MoM swing, imply Pheotera Grove is leaning into premiumized Topicals while absorbing annual volume attrition, a positioning that banks on price realization over breadth. Because Topical holds 100.0% of mix and rank is unreported in Illinois, the +28.0% MoM suggests tactical responsiveness within the category rather than cross-category share capture, pointing to a need to either deepen Topical differentiation at an average price of $29.43 or reintroduce adjacent formats to hedge against the -27.6% YoY drag; the pattern implies the current stance is concentrated pricing power with limited buffer against category-level swings.
Competitive Landscape
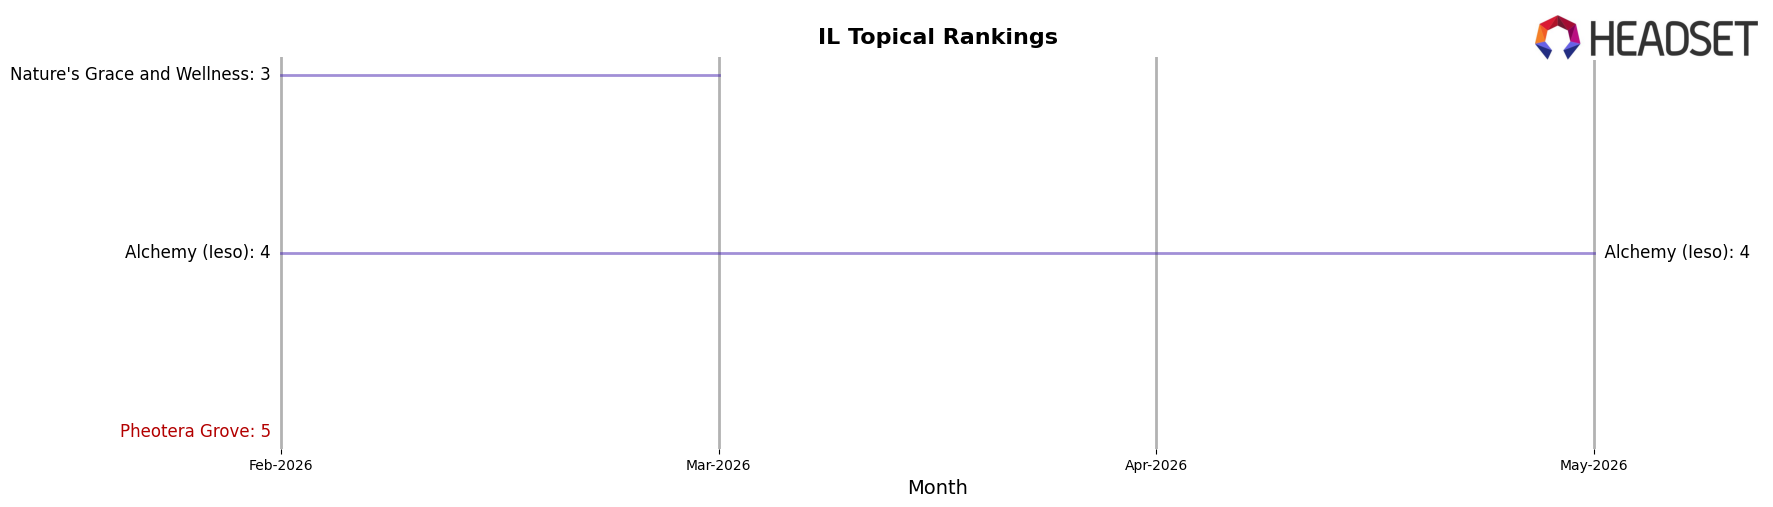
Pheotera Grove sits at rank #6 in IL Topical in May 2026, down 1 position from #5 year over year, and also 1 place below its February-to-May 2026 three-month mark of #5; against its January 2026 peak of #4, the brand is 2 spots lower. Competitors moved differently: Alluris Wellness rose from #6 to #5 while posting a 2.0% year-over-year sales increase, whereas category leaders Avexia and Doctor Solomon's held #1 and #2 with year-over-year declines of 17.1% and 16.2% respectively, and Nature's Grace and Wellness remained #3 despite a 62.8% contraction. The pattern—minor rank slippage alongside a competitor gaining share and top-tier incumbents contracting—implies Pheotera Grove’s recent trajectory risks further erosion unless it counters the upward move at #5 while exploiting weakness at the top.
Notable Products
CBD/THC 1:1 Pain Stick Balm (100mg CBD, 100mg THC, 2oz) posted the largest move with a +93.6% month-over-month jump and rose to rank 1, while Kick The Itch Lotion (100mg THC, 4oz) fell -79.9% and slid to rank 2. CBD/THC 1:1 Pain Stick Balm (25mg CBD, 25mg THC, 0.5oz) dropped -94.5% to rank 3, and all three top-10 placements sit within the Topical category, concentrating the portfolio into a single form factor. The divergence—one SKU surging nearly double while two legacy variants contract by -79.9% and -94.5%—implies the brand is consolidating demand into the flagship 2oz format, signaling a shift toward fewer, higher-velocity Topicals rather than a broad size ladder.
Top Selling Cannabis Brands
Data for this report comes from real-time sales reporting by participating cannabis retailers via their point-of-sale systems, which are linked up with Headset’s business intelligence software. Headset’s data is very reliable, as it comes digitally direct from our partner retailers. However, the potential does exist for misreporting in the instance of duplicates, incorrectly classified products, inaccurate entry of products into point-of-sale systems, or even simple human error at the point of purchase. Thus, there is a slight margin of error to consider. Brands listed on this page are ranked in the top twenty within the market and product category by total retail sales volume.

