.svg)

Aug-2026
Sales
Trend
6-Month
Product Count
SKUs
Avg Price
YoY Sales Change
YoY Price Change


Market Insights Snapshot
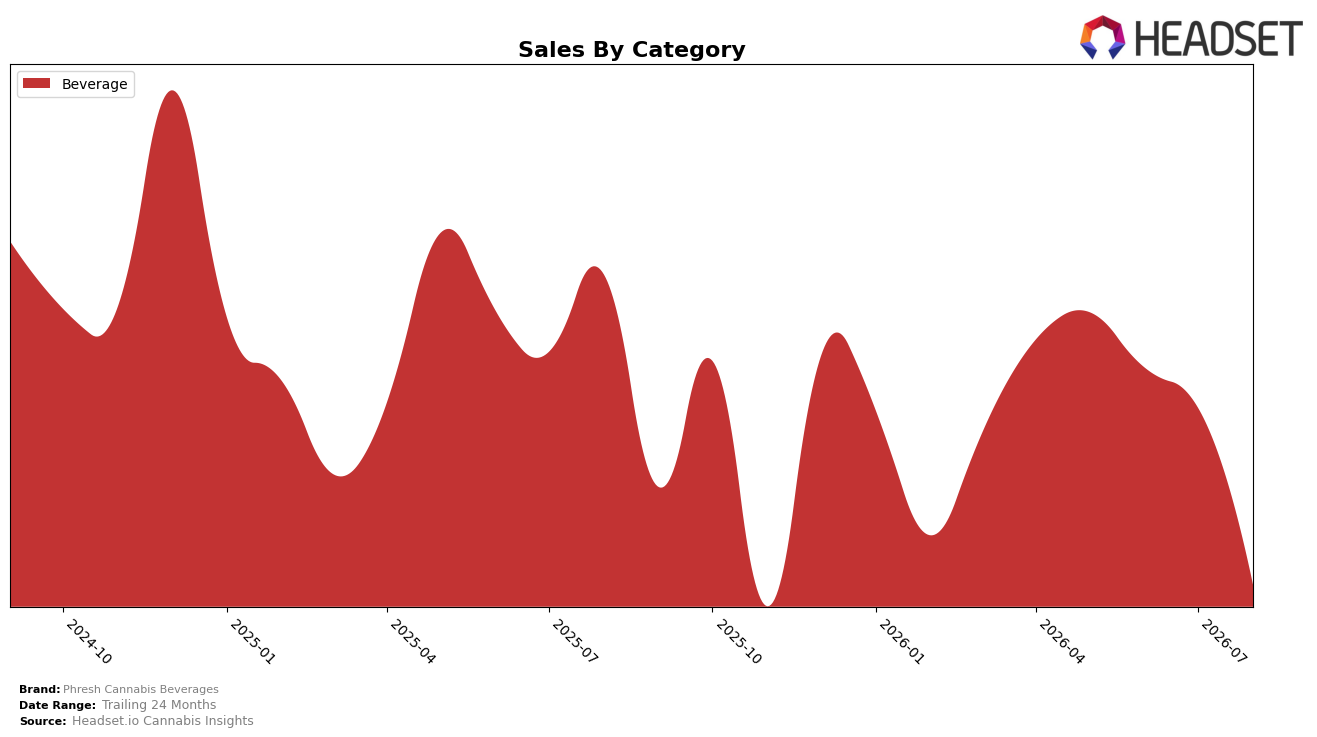
In August 2026, Phresh Cannabis Beverages operated as a single-category brand, with Beverage at 100.0% of sales share and a rank of 9 in Ontario, while year-over-year sales declined by 21.36% and month-over-month sales fell 13.44%. Average price rose 0.18% year over year to $6.06, yet overall brand sales were down 21.36% YoY and 39.09% versus 24 months, indicating that price firmness did not offset volume contraction. The pattern implies concentration risk: with all revenue in Beverage and a rank of 9, any category-wide softness or pricing friction translates directly into share and rank vulnerability.
These shifts point to positioning drift toward value-sensitive segments: a 0.18% YoY price increase alongside a 13.44% MoM sales decline suggests elasticity pressures at the current $6.06 price point, while a 21.36% YoY sales drop within a 100.0% Beverage mix compresses headroom for premiumization. Holding rank at 9 in Ontario amid a 39.09% 24‑month sales contraction and a 13.44% MoM decline indicates that maintaining visibility likely requires either price recalibration or pack/format innovation within Beverage rather than category expansion. The implication is a need to defend rank through mix tactics inside Beverage, because the single-category focus magnifies small pricing or velocity changes into outsized rank and share effects.
Competitive Landscape
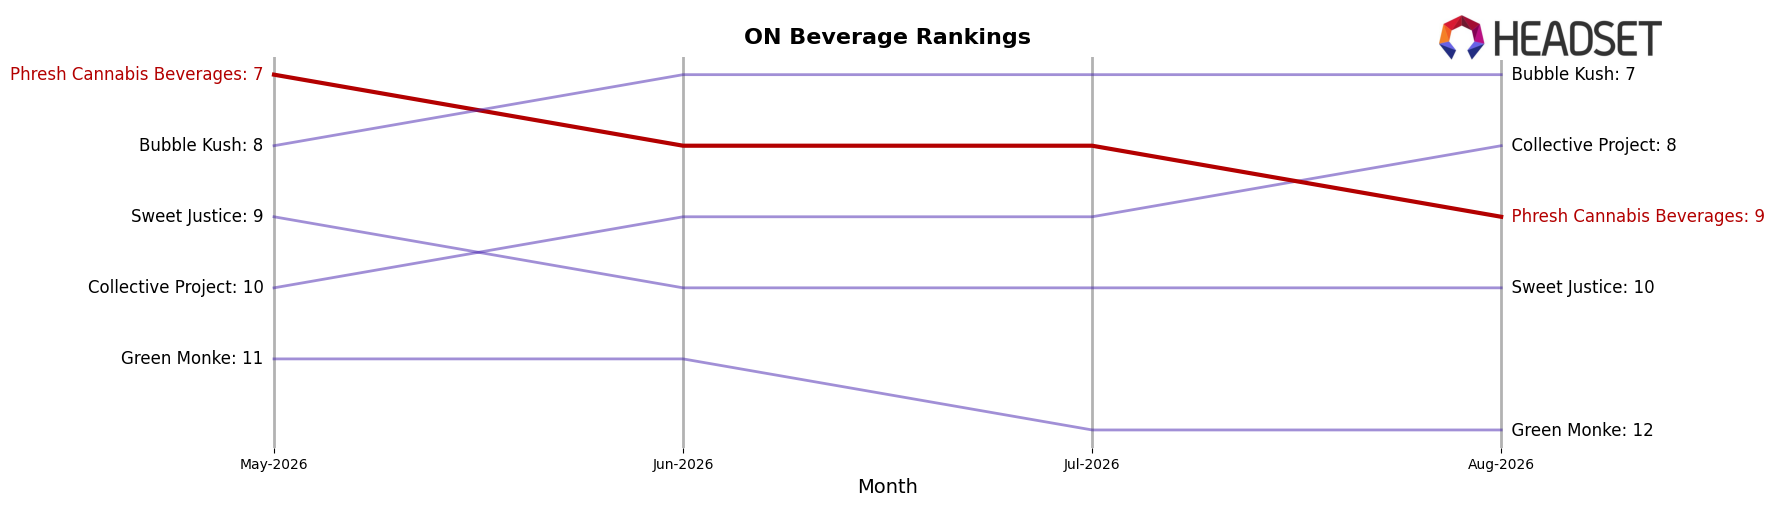
Phresh Cannabis Beverages sits at rank #9 in ON Beverage in August 2026, down 3 positions year over year from #6, and 2 positions lower than May 2026’s #7; versus its historical peak of #3 in August 2024, the brand has ceded 6 ranks. Competitive movement suggests pressure from mixed trajectories: XMG held #1 year over year at #1 despite a 31.4% sales decline, while Versus rose from #3 to #2 with a 7.0% sales increase, and Mollo slipped from #2 to #3 alongside a 13.8% contraction; meanwhile, Ray's Lemonade advanced from #5 to #4 with 14.5% growth and Mary Jones climbed from #8 to #5 with 44.0% growth. The pattern implies that Phresh Cannabis Beverages’ rank erosion from #6 to #9 while competitors either maintain leadership amid declines or capture share via double-digit growth signals a relative under-index in velocity or distribution that, if unaddressed, risks further slide against faster-moving rivals.
Notable Products
Blue Raspberry Sparking Water (10mg THC, 100ml) posted the steepest August 2026 decline at -22.2% while sliding to rank 4, and Cherry Sparkling Water (10mg THC, 355ml) fell -24.2% at rank 8, indicating concentrated softness in fruit-forward extensions. At the top, Strawberry Kiwi Sparking Water (10mg THC, 355ml) contracted -13.4% yet held rank 1, whereas Mango Peach Sparking Water (10mg THC, 355ml) grew 6.7% at rank 3, signaling mixed elasticity among leading flavors. Nine of the top ten are THC Sparkling Water SKUs, with only two CBD variants sitting at ranks 7 and 9 and dropping -13.5% and -23.2%, respectively, which suggests THC-led demand is stabilizing share even as several flavors retrench. The pattern implies Phresh Cannabis Beverages is tilting toward fewer, higher-velocity THC formats while pruning flavor breadth rather than leaning into CBD variety, a shift likely to concentrate marketing and inventory on rank 1–3 winners.
Top Selling Cannabis Brands






Data for this report comes from real-time sales reporting by participating cannabis retailers via their point-of-sale systems, which are linked up with Headset’s business intelligence software. Headset’s data is very reliable, as it comes digitally direct from our partner retailers. However, the potential does exist for misreporting in the instance of duplicates, incorrectly classified products, inaccurate entry of products into point-of-sale systems, or even simple human error at the point of purchase. Thus, there is a slight margin of error to consider. Brands listed on this page are ranked in the top twenty within the market and product category by total retail sales volume.

