.svg)
Sep-2026
Sales
Trend
6-Month
Product Count
SKUs
Avg Price
YoY Sales Change
YoY Price Change


Market Insights Snapshot
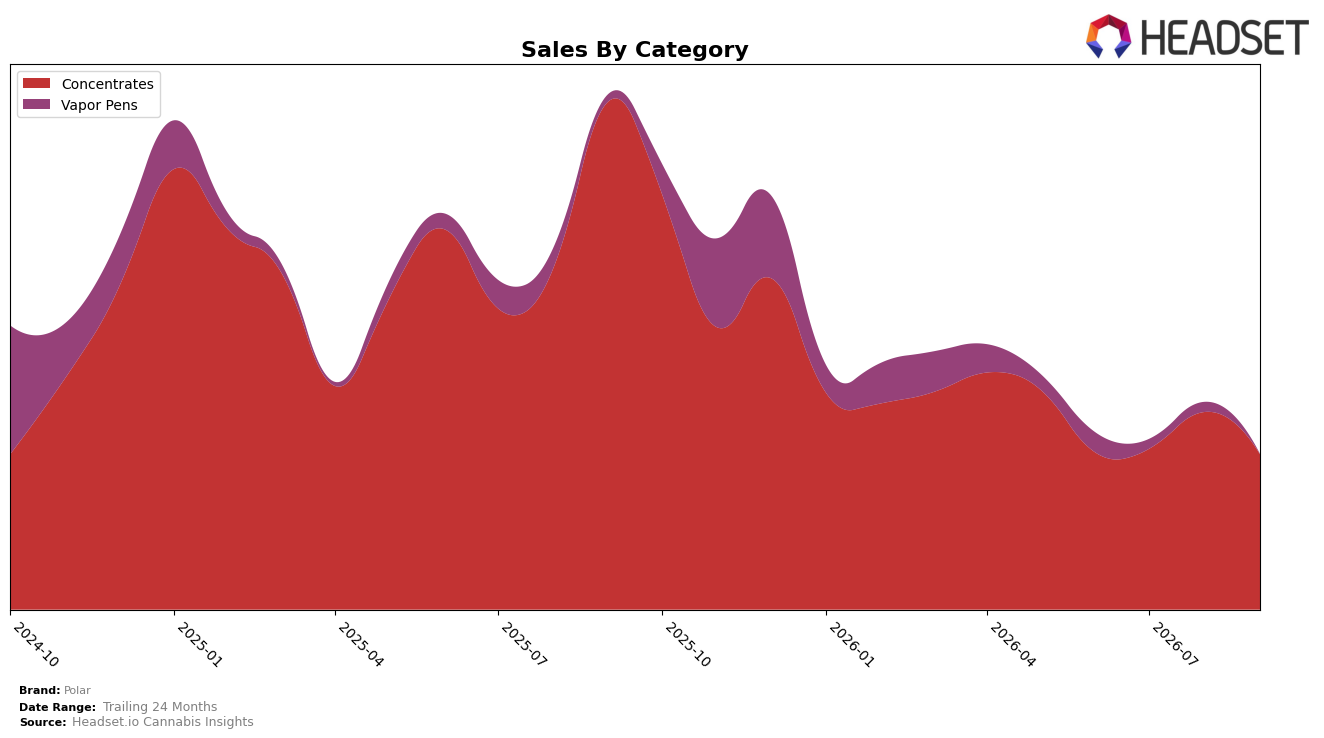
In September 2026, Polar’s mix concentrated further into Concentrates at 98.36% share, while Vapor Pens compressed to 1.64% share; within these, Concentrates declined 69.14% year over year and 21.18% month over month, and Vapor Pens fell 73.02% year over year and 78.72% month over month. Average price edged down 1.44% year over year to $47.16, with Concentrates averaging $47.11 and Vapor Pens at $50.01; the combined pattern indicates the brand is leaning into a narrower portfolio while both core and fringe categories contract at double‑digit rates, implying a volume‑led reset rather than price‑driven erosion.
With Concentrates ranked 42 in Ontario and at 98.36% of sales amid a 21.18% month‑over‑month pullback, Polar’s positioning is tethered to a lower‑tier rank and high category concentration, suggesting limited buffer against further share swings. The 73.02% year‑over‑year decline in Vapor Pens alongside a 69.14% year‑over‑year drop in Concentrates indicates demand and distribution pressure across adjacent inhalable formats, implying that stabilization requires either re‑entry into faster‑rebounding segments or improved velocity within Concentrates to lift rank from 42 while managing the 1.44% price deflation without deeper discounting.
Competitive Landscape
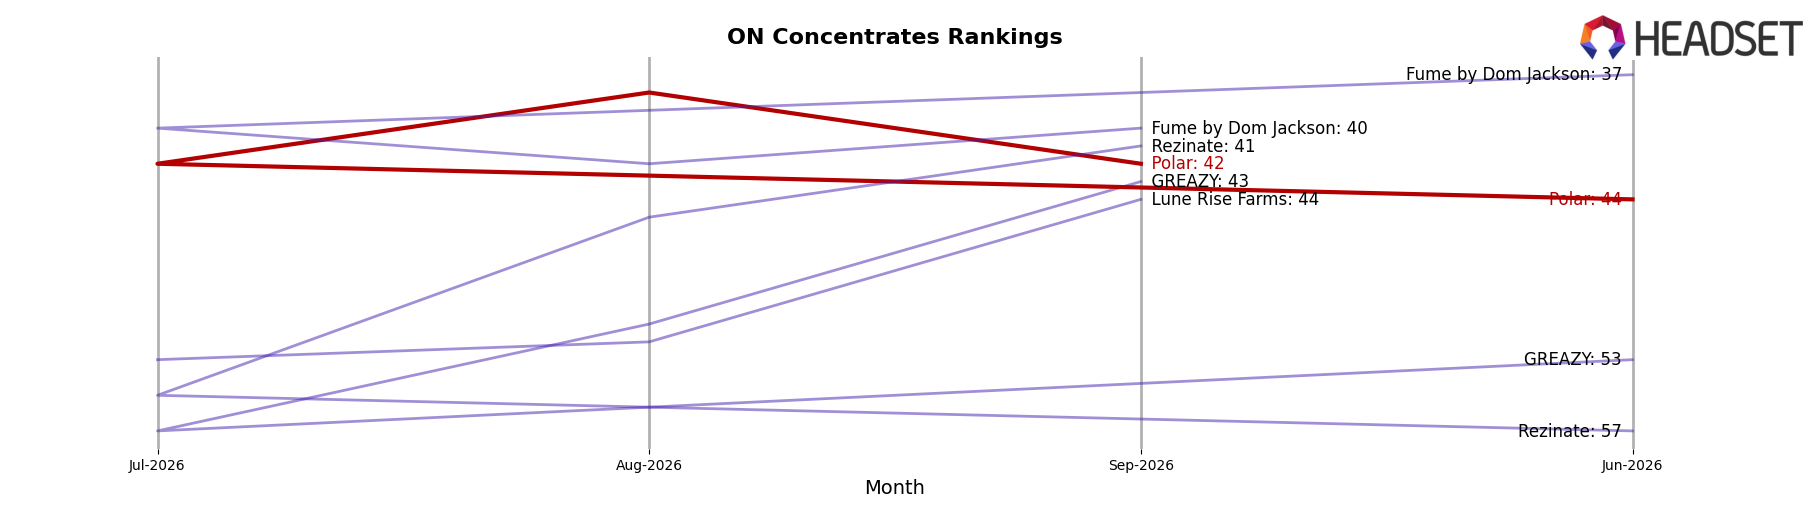
Polar sits at rank #42 in ON Concentrates in September 2026, down 19 positions year over year from #23, and 2 spots lower than June 2026’s #44 to #42 move signals only a short-term lift against a longer YoY slide. While Polar declined, BoxHot advanced from #9 to #5 with a 52.3% YoY sales increase, and Pura Vida rose from #4 to #2 with 37.2% YoY growth, indicating share consolidation near the top as Nugz (Canada) fell from #2 to #3 on a 30.8% YoY decline. Polar’s current #42, compared with its peak #23 in September 2025, implies that without a reversal of the YoY rank erosion, recent quarter-on-quarter stability is unlikely to restore its prior competitive position.
Notable Products
Bananium Live Hash Rosin (1g) posted the steepest decline at -42.4% MoM, sliding to rank 2 in September 2026 while Black Mountain Side Live Hash Rosin (1g) fell -22.5% MoM but held rank 1. In contrast, Arctic Drop Live Rosin (1g) climbed +43.5% MoM yet remained at rank 3, leaving the top two spots occupied by SKUs with negative or lagging momentum relative to the riser. With three of the top four SKUs in Concentrates and Vapor Pens contributing limited offset, the pattern implies Polar is over-indexed to a flagship that is softening while the emerging winner is not yet converting share into rank gains, signaling near-term reliance on depth within Concentrates rather than diversification.
Top Selling Cannabis Brands






Data for this report comes from real-time sales reporting by participating cannabis retailers via their point-of-sale systems, which are linked up with Headset’s business intelligence software. Headset’s data is very reliable, as it comes digitally direct from our partner retailers. However, the potential does exist for misreporting in the instance of duplicates, incorrectly classified products, inaccurate entry of products into point-of-sale systems, or even simple human error at the point of purchase. Thus, there is a slight margin of error to consider. Brands listed on this page are ranked in the top twenty within the market and product category by total retail sales volume.

