Jun-2026
Sales
Trend
6-Month
Product Count
SKUs
Avg Price
YoY Sales Change
YoY Price Change
Market Insights Snapshot
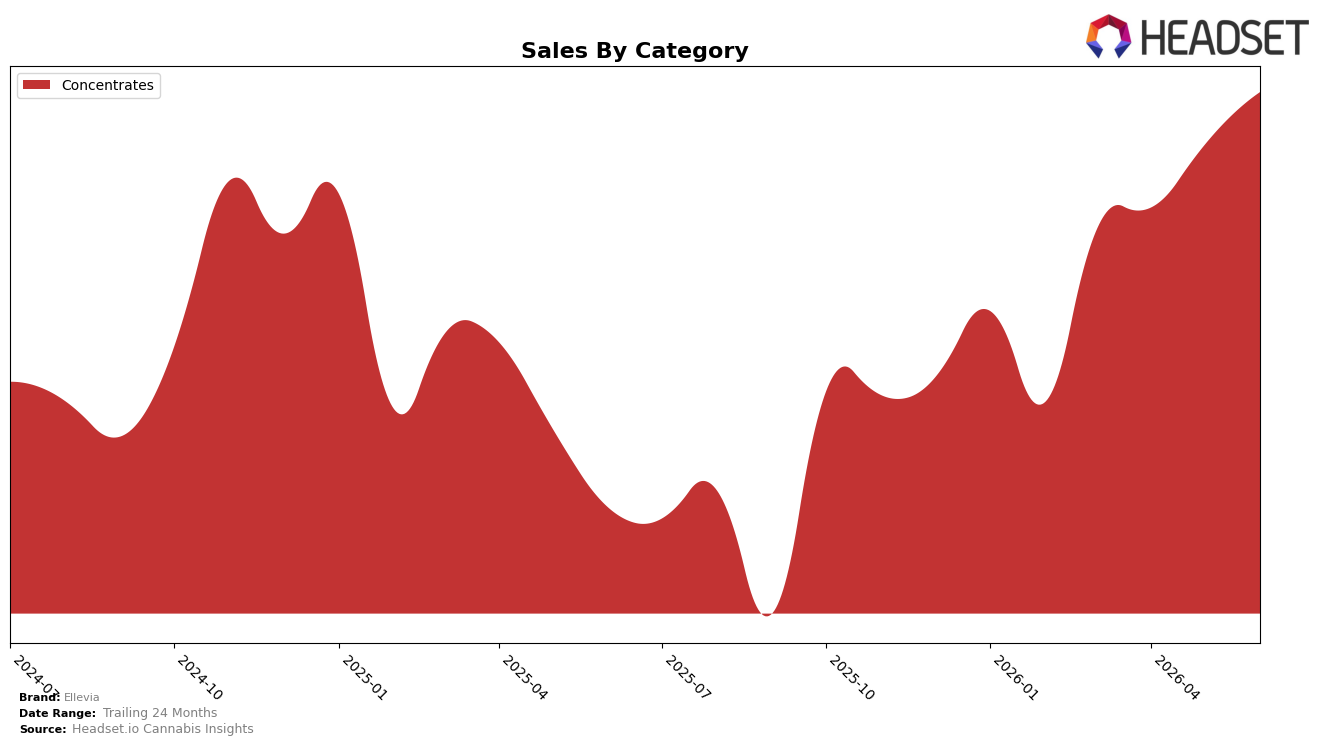
Ellevia operated as a single-category brand in June 2026, with Concentrates accounting for 100.0% of sales and a month-over-month sales change of 4.85% alongside a year-over-year increase of 57.18%. The brand’s average price was $28.48 with a year-over-year price decline of 1.34%, which paired with category share at 100.0% indicates mix stability rather than price-led expansion. In Ontario Concentrates, Ellevia held rank 22, which, together with a 4.85% MoM lift and 57.18% YoY growth, implies growth is coming from deeper penetration within a single lane rather than cross-category breadth.
The consolidation into Concentrates at 100.0% share and a rank of 22 in Ontario suggests a positioning anchored to a specialist identity, where the 1.34% YoY price decrease likely traded a small amount of unit revenue for volume that delivered the 57.18% YoY sales gain. With only a 4.85% MoM rise against a 57.18% YoY increase, momentum is skewed toward longer-cycle adoption rather than short-term spikes, implying that Ellevia’s path to improved rank will rely on sustained velocity at roughly current price points rather than diversification or premiumization in the immediate term.
Competitive Landscape
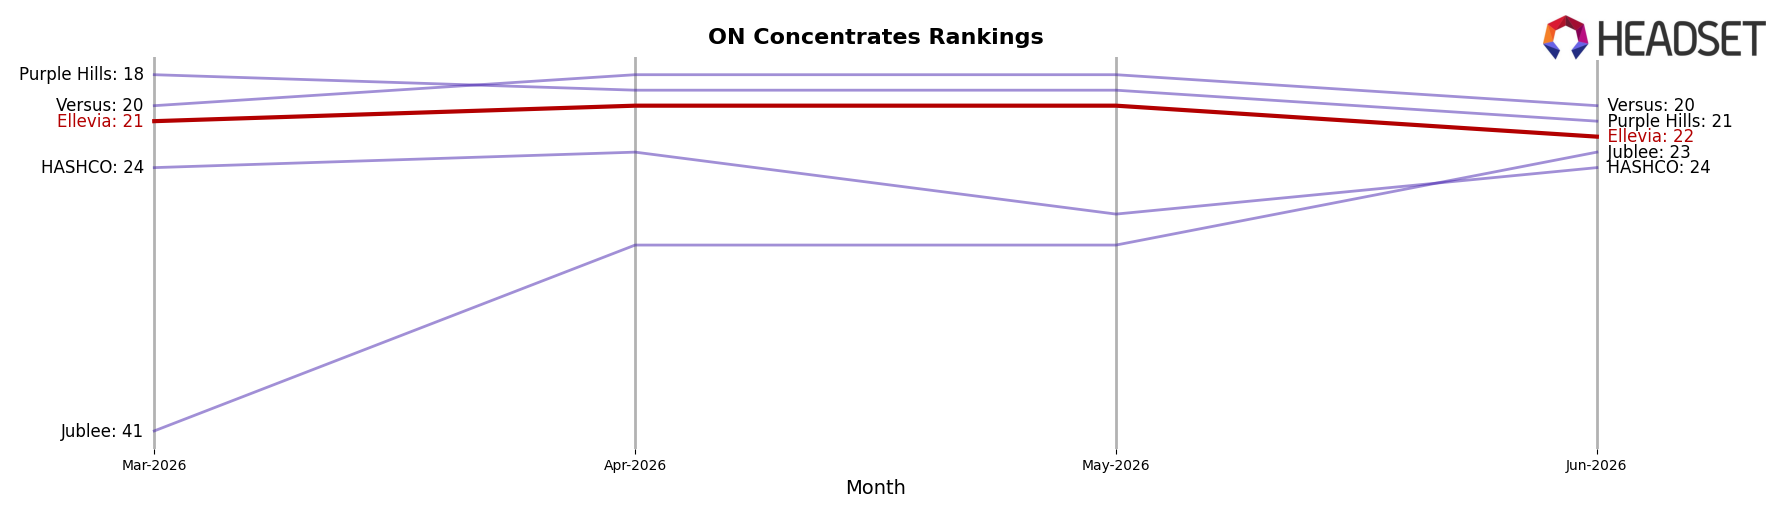
Ellevia sits at rank #22 in ON Concentrates for June 2026, improving 4 positions from #26 year over year, yet slipping 1 spot from #21 in March 2026 and off a peak of #20 reached in May 2026; meanwhile, Pura Vida climbed from #4 to #2 alongside a 49.2% YoY sales gain while Nugz (Canada) moved down from #2 to #3 with a 6.6% YoY decline, indicating Ellevia’s upward YoY rank change is happening amid mixed competitor momentum and suggests a gradual, opportunity-led path rather than a breakout, with near-term share likely contingent on sustaining movement from #22 back toward the May 2026 peak at #20.
Notable Products
RSO Resin (1g) posted the standout movement in June 2026 with a +3,500% month-over-month surge to rank 3, eclipsing the already large +98% jump for RSO Full Spectrum (1g) at rank 1. RSO Full Spectrum (4g) also climbed sharply at +86% to rank 2, putting three RSO formats into the top five and concentrating the lineup in Concentrates. This stack of gains at ranks 1, 2, and 3, alongside a +19% move for Hybrid RSO Dispenser (1g) at rank 4, implies Ellevia is pivoting decisively toward RSO-led Concentrates as its commercial core.
Top Selling Cannabis Brands
Data for this report comes from real-time sales reporting by participating cannabis retailers via their point-of-sale systems, which are linked up with Headset’s business intelligence software. Headset’s data is very reliable, as it comes digitally direct from our partner retailers. However, the potential does exist for misreporting in the instance of duplicates, incorrectly classified products, inaccurate entry of products into point-of-sale systems, or even simple human error at the point of purchase. Thus, there is a slight margin of error to consider. Brands listed on this page are ranked in the top twenty within the market and product category by total retail sales volume.

