.svg)

Sep-2026
Sales
Trend
6-Month
Product Count
SKUs
Avg Price
YoY Sales Change
YoY Price Change


Where to Buy
Ratio (WA) is stocked at 65 licensed dispensaries across Washington, with the deepest coverage in Everett, Tacoma, Seattle, Spokane, and Vancouver. Search by ZIP code or city below to find the closest one, or filter by product type if you are after a specific format.
Market Insights Snapshot
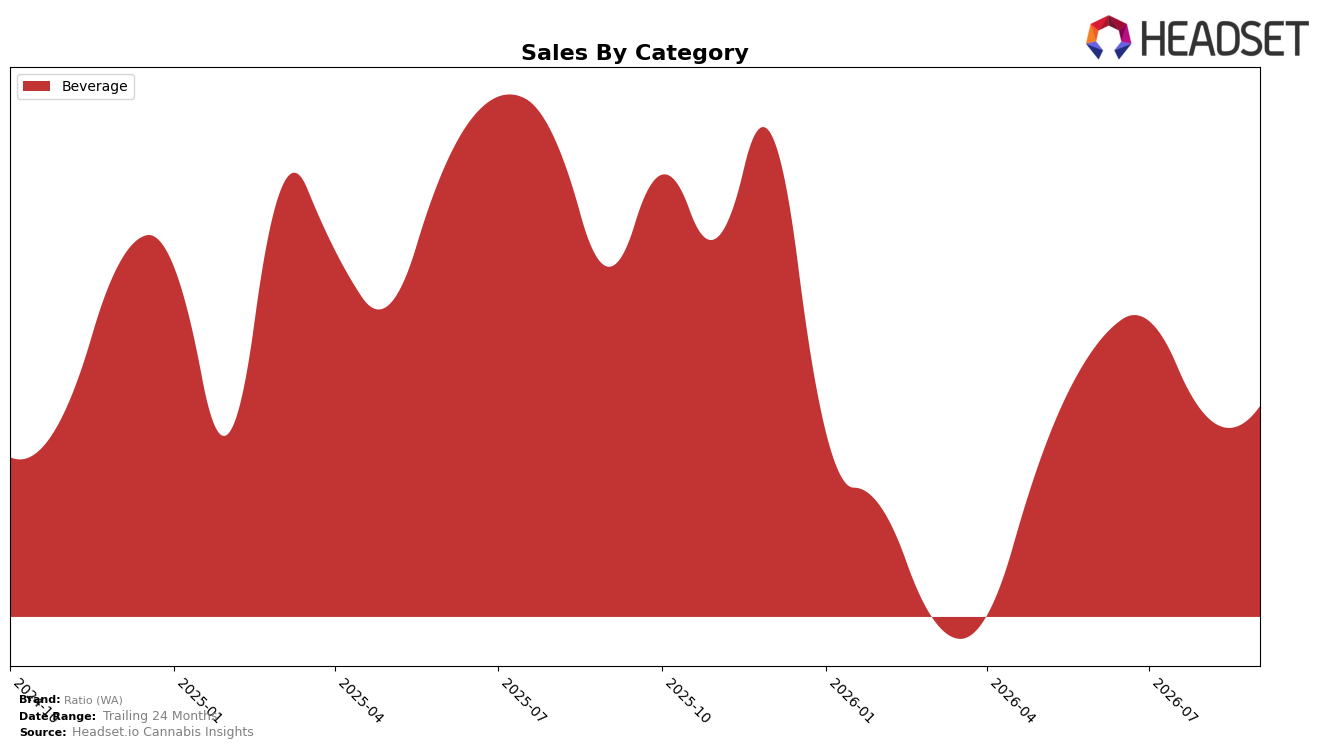
In September 2026, Ratio (WA) operated as a single-category brand with Beverage at 100.0% of sales, posting a year-over-year decline of 13.19% alongside a month-over-month uptick of 0.91%. Average price moved down 2.48% YoY to $5.01, while the brand held a rank of 10 within Beverage in Washington. The pattern implies a concentrated portfolio that is absorbing YoY pressure while marginal MoM volume momentum and a modest price trim reallocate mix entirely toward defending Beverage share.
The shift—flat category breadth but lower YoY sales against a small MoM rise—signals a positioning anchored in value-access Beverage, where a 2.48% YoY price reduction coexists with 0.91% MoM growth and a rank of 10. With 13.61% sales growth over 24 months contrasted by a 13.19% YoY contraction, the implication is a maturing niche: near-term price elasticity can stabilize rank but, without diversification beyond Beverage’s 100.0% mix, future gains will depend on deepening penetration within Washington Beverage rather than mix expansion.
Competitive Landscape
Ratio (WA) sits at #10 in WA Beverage in September 2026, down 2 ranks year over year from #8 and off 1 rank from June 2026’s #9, while still below its #7 peak from October 2025; meanwhile, Journeyman climbed from #2 to #1 with 36% YoY sales growth and Blaze Soda rose from #7 to #4 alongside a 96.8% YoY increase, outpacing Ratio (WA)’s rank trajectory as Ray's Lemonade slipped from #1 to #2 on a -26.6% decline and Green Revolution fell from #4 to #5 with -32.9% YoY sales. The combination of a 2-position YoY drop and proximity to faster-rising competitors implies Ratio (WA) is losing relative velocity in the middle tier, suggesting that without share-capturing moves it risks further slippage against brands converting growth into rank gains.

Notable Products
Orange Breeze Shot (100mg THC, 2.5oz) posted the standout movement with a 13.0% month-over-month gain while climbing to rank 2, whereas Strawberry Burst Shot (100mg THC, 2.5oz) slipped 6.0% and still held rank 1. Island Punch Shot (100mg THC, 2.5oz) eased 2.0% at rank 3 and Island Coconut Shot (100mg THC, 2.5oz) fell 4.2% at rank 4, together indicating modest softening across legacy leaders even as one flavor accelerated. The concentration is total, with eight of the top ten being Beverage shots in September 2026 and the top four ranks all occupied by 100mg THC shot SKUs, pointing to a flavor-led battle for share rather than a form-factor shift.
Mid-tier formulations mixed outcomes: CBN/CBD/THC 1:1:2 Grape Dream Shot (50mg CBN, 50mg CBD, 100mg THC, 2.5oz) surged 46.8% to rank 8 while the 25/25/50mg variant dipped 2.6% at rank 5, and the CBD/THC 1:1 Raspberry Lemonade Shot rose 22.8% at rank 6 as its 100/100mg counterpart fell 5.6% at rank 7. This split, alongside $19,364 in September 2026 sales for Strawberry Burst Shot at rank 1 and 2,329 units for the rising Raspberry Lemonade 1:1 at rank 6, implies potency and minor-cannabinoid mixes are being selectively adopted where flavor and dose hit a perceived sweet spot. The pattern suggests Ratio (WA) is consolidating a Beverage-first portfolio where incremental share shifts hinge on flavor rotation and calibrated cannabinoid ratios rather than wholesale re-pricing or pack-size changes.
Top Selling Cannabis Brands






Data for this report comes from real-time sales reporting by participating cannabis retailers via their point-of-sale systems, which are linked up with Headset’s business intelligence software. Headset’s data is very reliable, as it comes digitally direct from our partner retailers. However, the potential does exist for misreporting in the instance of duplicates, incorrectly classified products, inaccurate entry of products into point-of-sale systems, or even simple human error at the point of purchase. Thus, there is a slight margin of error to consider. Brands listed on this page are ranked in the top twenty within the market and product category by total retail sales volume.

