Jun-2026
Sales
Trend
6-Month
Product Count
SKUs
Avg Price
YoY Sales Change
YoY Price Change
Market Insights Snapshot
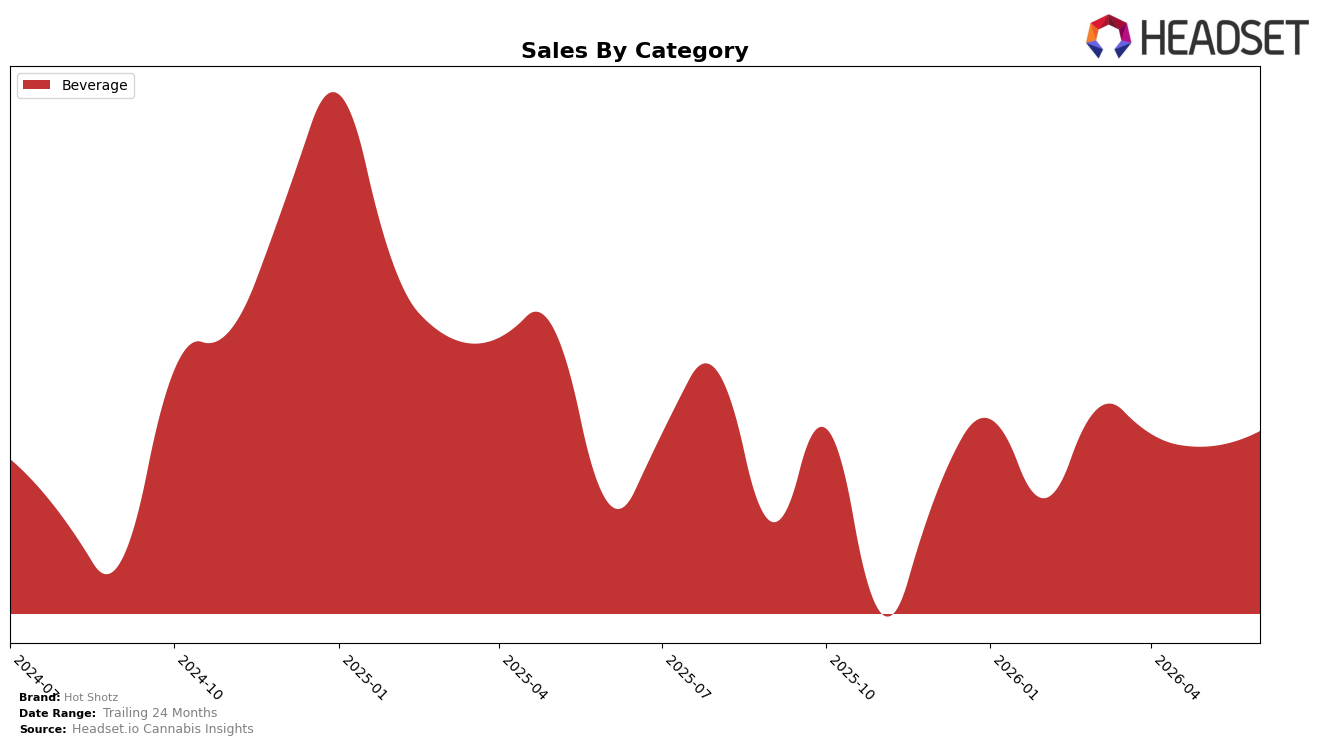
In June 2026, Hot Shotz remained 100.0% concentrated in Beverage, with category sales up 6.92% year over year and 1.43% month over month, while average price declined 3.89% YoY alongside a fully allocated category mix. The brand held rank 10 in Beverage in Washington, pairing a 6.92% YoY sales lift with a 1.43% MoM gain, which indicates volume expansion offsetting price compression.
This single-category focus implies Hot Shotz is competing on unit velocity rather than assortment breadth, as a 3.89% YoY price decrease coincides with a 6.92% sales increase, suggesting elastic demand that favors promotion or value-tier positioning. Holding rank 10 in Beverage in Washington alongside a 1.43% MoM uptick points to incremental share defense via pricing rather than premiumization, meaning near-term gains will depend on sustaining mix discipline in Beverage and converting price-led traffic into repeat purchases.
Competitive Landscape
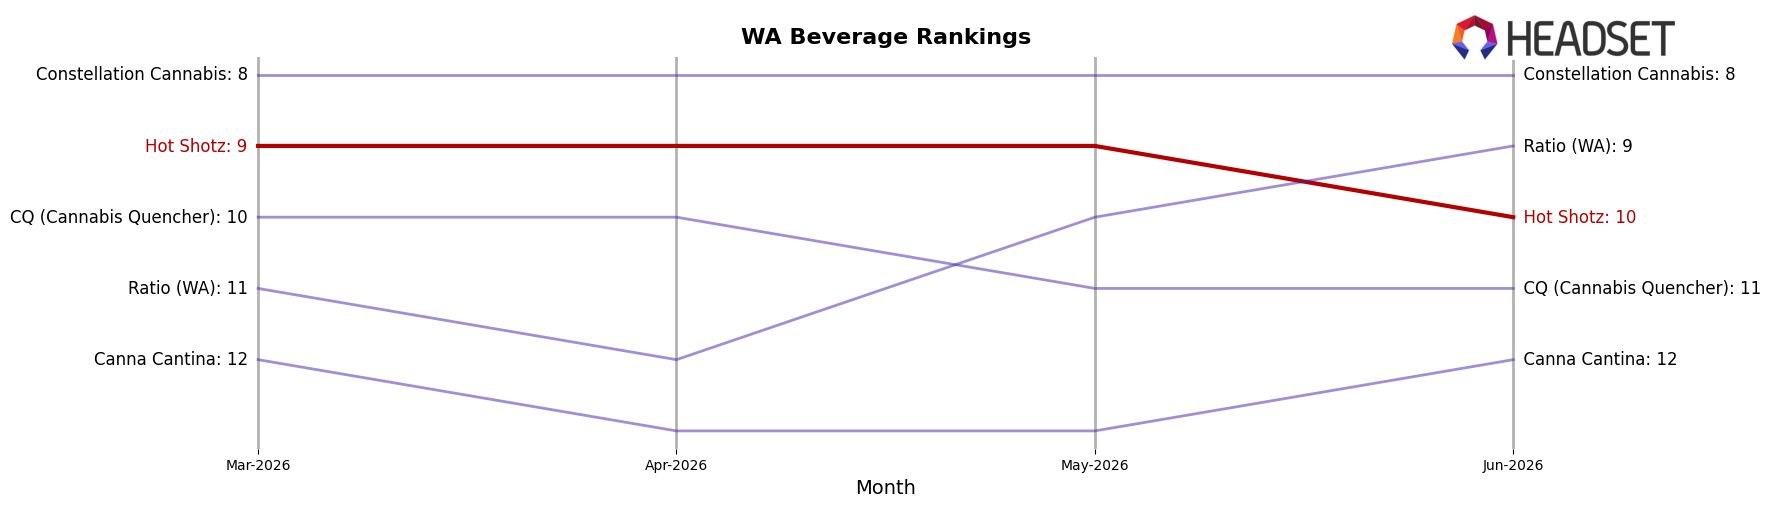
Hot Shotz ranks #10 in WA Beverage in June 2026, unchanged YoY from #10, after slipping 1 position from #9 three months ago and sitting 3 spots below its April 2025 peak at #7; meanwhile, Journeyman edged up from #2 to #1 with sales up 1.9% YoY, and Ray's Lemonade fell from #1 to #2 with sales down 30.3% YoY, indicating that Hot Shotz’s flat YoY rank alongside competitor churn implies a stable but stagnant position where incremental share shifts can displace it further without targeted action.
Notable Products
Dragon Fruit Energy Shot (100mg THC, 2oz) posted the standout move in June 2026 with a +299.2% month-over-month surge to rank 2 while the Green Apple Energy Drink (100mg THC, 2oz) slid -10.6% at rank 5, indicating demand is shifting toward shots over traditional flavors. Blue Raspberry Energy Drink (100mg THC, 2oz) held rank 1 despite a -1.2% decline, and the THC/CBN 2:1 Huckleberriez Energy Shot (100mg THC, 50mg CBN, 2oz, 59ml) jumped +36.4% at rank 10, showing momentum at both the very top and the tail. Eight of the top ten are Beverage SKUs from the same energy shot/drink family, concentrating volume in a narrow form factor with a single category accounting for $82,286. The pattern implies Hot Shotz is tilting toward high-potency, functional shots that can rapidly displace slower legacy flavors within the same category mix.
Top Selling Cannabis Brands
Data for this report comes from real-time sales reporting by participating cannabis retailers via their point-of-sale systems, which are linked up with Headset’s business intelligence software. Headset’s data is very reliable, as it comes digitally direct from our partner retailers. However, the potential does exist for misreporting in the instance of duplicates, incorrectly classified products, inaccurate entry of products into point-of-sale systems, or even simple human error at the point of purchase. Thus, there is a slight margin of error to consider. Brands listed on this page are ranked in the top twenty within the market and product category by total retail sales volume.

