Jun-2026
Sales
Trend
6-Month
Product Count
SKUs
Avg Price
YoY Sales Change
YoY Price Change
Market Insights Snapshot
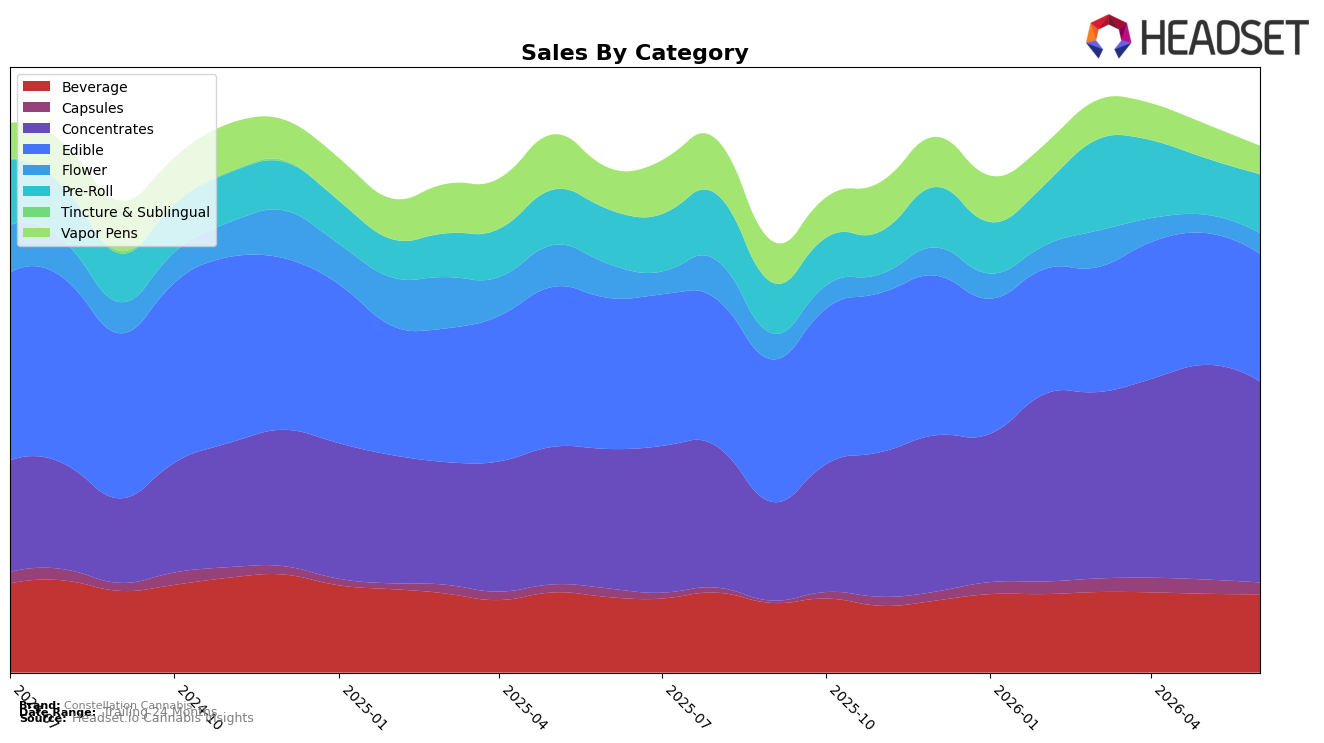
In June 2026, Constellation Cannabis leaned into Concentrates at 38.20% share with year-over-year growth of 44.08% but a month-over-month dip of 6.38%, while Edible held 24.27% share with a -15.52% YoY decline and a -3.25% MoM slide. Beverage contributed 14.87% share with 3.61% YoY growth and a -0.75% MoM change, and Pre-Roll reached 11.18% share with 8.14% YoY growth and a 3.65% MoM gain. Vapor Pens fell to 5.34% share with -32.03% YoY and -17.30% MoM, contrasted by Capsules at 2.23% share with 38.73% YoY but -16.81% MoM, and Flower at 3.91% share with -39.31% YoY yet a 13.48% MoM uptick. With Concentrates ranked 3 in Washington and the brand’s overall sales up 4.34% YoY despite a -6.19% 24‑month trend, the mix points to reliance on a high-growth flagship category offsetting persistent weakness in legacy inhalables.
The pattern implies a deliberate tilt toward higher-price, higher-velocity niches where price points like $23.09 in Concentrates coexist with a 0.22% YoY lift in the brand’s overall average price, while subscale areas such as Vapor Pens at -17.30% MoM and -32.03% YoY are being deprioritized relative to Pre-Roll’s 3.65% MoM and 8.14% YoY recovery. The 13.48% MoM rebound in Flower against a -39.31% YoY slide, alongside Capsules’ 38.73% YoY growth but -16.81% MoM dip, indicates opportunistic, tactical swings rather than structural reinvestment, positioning the brand to defend a top-three Concentrates rank in Washington while using selective Pre-Roll and Beverage gains to stabilize share as Edible contracts by -15.52% YoY.
Competitive Landscape
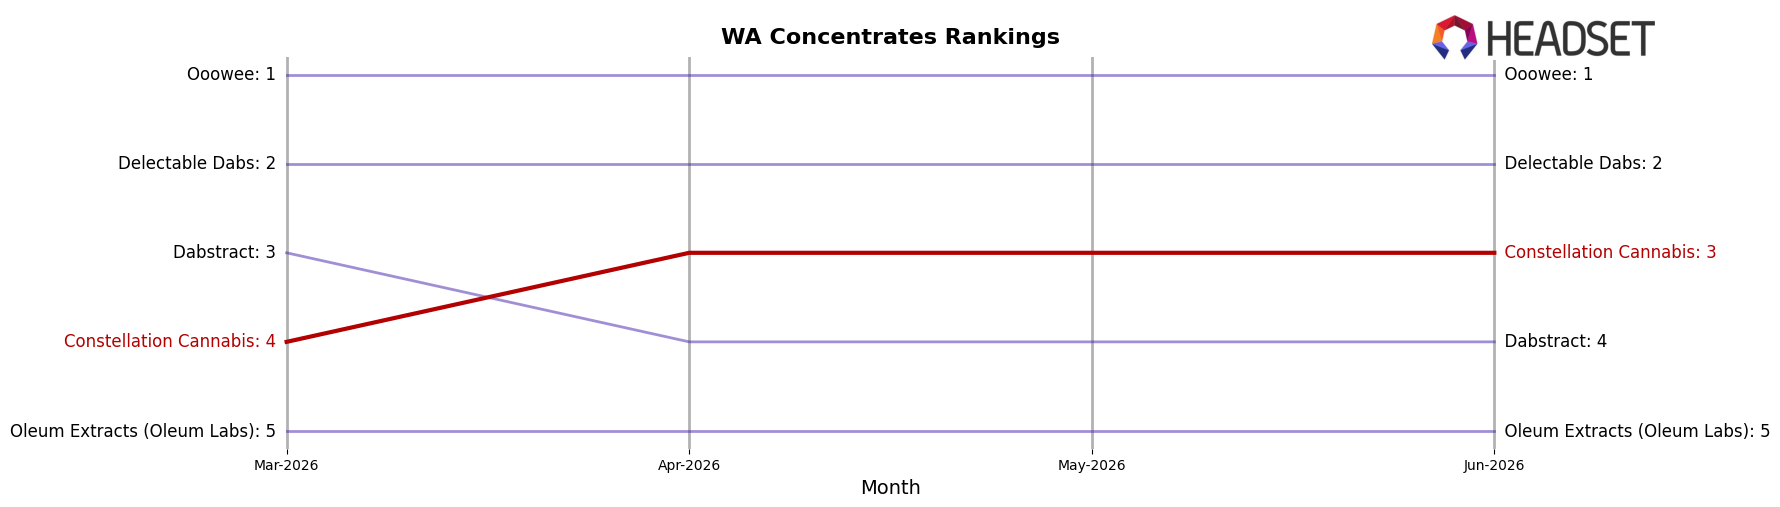
Constellation Cannabis sits at rank #3 in Washington Concentrates in June 2026 after rising 4 positions year over year from #7, and improving 1 spot from #4 in March 2026 to a peak of #3 in June 2026; by contrast, Ooowee held at #1 year over year while its sales declined 6.8%, and Dabstract moved up from #5 to #4 alongside a 23.5% sales increase, indicating Constellation Cannabis’s climb is outpacing top-tier stability at #1 but will face pressure from fast-moving #4. The combination of a 4-rank YoY gain and a new peak at #3 implies a transition from mid-pack to consistent top-three contender, with momentum that, if maintained, positions the brand to challenge #2 despite a tightening chase from #4.
Notable Products
The steepest decline came from Moonshot - Peach Mango Nano Emulsified Hash Rosin Beverage (100mg THC, 1.7oz), down 11.95% month over month while sliding to rank 7, as Gravity - CBN/CBD/THC 1:1:1 Blueberry Hash Rosin Gummies 10-Pack fell 10.67% at rank 9, signaling pressure on secondary flavors and multi-cannabinoid edibles. Meanwhile, Moonshot - Blue Raspberry Nano Emulsified Hash Rosin Beverage (100mg THC, 1.7oz) rose 6.40% to hold rank 1 and Moonshot - Grape Nano Emulsified Hash Rosin Beverage (100mg THC, 1.7oz) climbed 24.66% to rank 4, and with four of the top five positions in June 2026 occupied by Beverage SKUs the mix is consolidating around fast-acting drinks over gummies. Gravity - CBG/CBD/THC 1:1:1 Watermelon Hash Rosin Gummies 10-Pack slipped 8.44% while retaining rank 3 and $29,587, and Moonshot - Green Apple Nano Emulsified Hash Rosin Beverage (100mg THC, 1.7oz) dipped 8.07% at rank 2, implying flavor rotation within beverages is less risky than reliance on multi-cannabinoid gummies for volume. The pattern points to a commercial tilt toward scaling Moonshot beverage variants that can absorb flavor churn while de-prioritizing slower edible SKUs to defend top-5 rank density and margin leverage.
Top Selling Cannabis Brands
Data for this report comes from real-time sales reporting by participating cannabis retailers via their point-of-sale systems, which are linked up with Headset’s business intelligence software. Headset’s data is very reliable, as it comes digitally direct from our partner retailers. However, the potential does exist for misreporting in the instance of duplicates, incorrectly classified products, inaccurate entry of products into point-of-sale systems, or even simple human error at the point of purchase. Thus, there is a slight margin of error to consider. Brands listed on this page are ranked in the top twenty within the market and product category by total retail sales volume.

