Jun-2026
Sales
Trend
6-Month
Product Count
SKUs
Avg Price
YoY Sales Change
YoY Price Change
Market Insights Snapshot
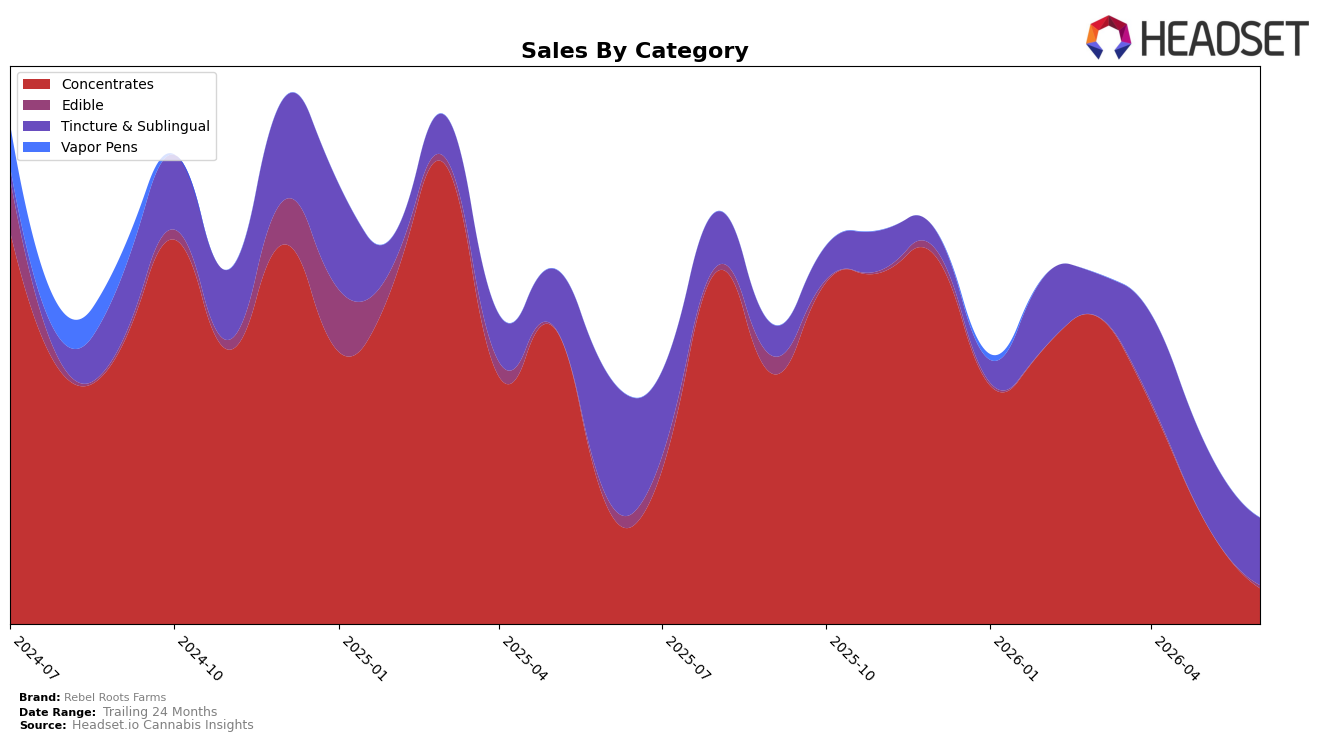
Rebel Roots Farms’ June 2026 mix is concentrated in Tincture & Sublingual at 63.67% share with a year-over-year decline of 46.28% and a month-over-month drop of 13.45%, while Concentrates hold 33.77% share but fell 69.03% YoY and 65.40% MoM. Edible sits at 2.56% share with a 68.78% YoY decline and no MoM reading, indicating a thin tail. Against this mix, total brand sales fell 57.59% YoY as average price rose 33.19%, implying that unit pullback rather than price compression drove the contraction. With Oregon as the top market and Concentrates as the top category by designation yet not by share, the pattern implies the brand’s commercial center has shifted toward value-priced Tincture & Sublingual even as flagship positioning in Concentrates has weakened.
The simultaneous 65.40% MoM slump in Concentrates and smaller 13.45% MoM decline in Tincture & Sublingual signals a rapid channel or SKU rationalization in inhalables while the ingestible-led mix cushions volatility. Coupled with a 24‑month sales decline of 79.97% and a current average price of $14.40, the trajectory implies the brand is migrating toward a lower-price, higher-mix Tincture & Sublingual stance rather than competing on breadth in Concentrates, which, without a current rank in Oregon Concentrates, suggests repositioning toward defensible niches over headline velocity categories.
Competitive Landscape
Rebel Roots Farms sits at rank #126 in OR Concentrates in June 2026, down 24 positions year over year from #102 and 47 positions below its March 2025 peak at #63, while also sliding 47 spots from #79 in March 2026 to #126 in June 2026; meanwhile, category leaders moved in the opposite direction, with Oregrown climbing from #3 to #2 on 153.4% YoY sales growth and Buddies rising from #8 to #4 alongside 77.1% YoY growth, whereas Altered Alchemy held #1 despite a 9.7% YoY decline and White Label Extracts (OR) slipped from #4 to #5 with a 2.6% YoY sales contraction; this divergence—Rebel Roots Farms falling 24 ranks YoY as upward movers gained 1–4 positions—implies that without a share recapture plan in faster-growing subsegments, the brand’s trajectory points toward prolonged mid-tier obscurity rather than re-entry to its prior top-75 range.

Notable Products
Rocket Fuel RSO (1g) posted the steepest decline in June 2026, down 70.9% MoM to rank 4, while Rocket Fuel Sativa Berry Pie Tincture (1000mg) fell 67.2% to rank 3, pointing to a contraction in Rocket Fuel-branded demand within both Concentrates and Tincture & Sublingual. Three of the top five positions are held by Concentrates, yet two of those—Rocket Fuel RSO (1g) at -70.9% and Berry Pie RSO (1g) at -66.4% to rank 5—lost share as Cherry Chem RSO (1g) rose to rank 1, implying mix shift toward a single winning RSO SKU at the expense of its siblings. In contrast, Infused Organic Olive Oil Tincture (1000mg THC, 2oz, 60ml) grew 28.9% MoM at rank 2 while Rocket Fuel Hybrid Berry Pie Tincture (1000mg) dropped 43.5% at rank 2 with $557 in sales, signaling consumer preference for utility-driven tinctures over flavor-led variants. The pattern implies Rebel Roots Farms is consolidating around fewer hero formats—one flagship RSO and one functional tincture—while breadth SKUs tied to Rocket Fuel or Berry Pie retreat.
Top Selling Cannabis Brands
Data for this report comes from real-time sales reporting by participating cannabis retailers via their point-of-sale systems, which are linked up with Headset’s business intelligence software. Headset’s data is very reliable, as it comes digitally direct from our partner retailers. However, the potential does exist for misreporting in the instance of duplicates, incorrectly classified products, inaccurate entry of products into point-of-sale systems, or even simple human error at the point of purchase. Thus, there is a slight margin of error to consider. Brands listed on this page are ranked in the top twenty within the market and product category by total retail sales volume.

