.svg)

Aug-2026
Sales
Trend
6-Month
Product Count
SKUs
Avg Price
YoY Sales Change
YoY Price Change


Market Insights Snapshot
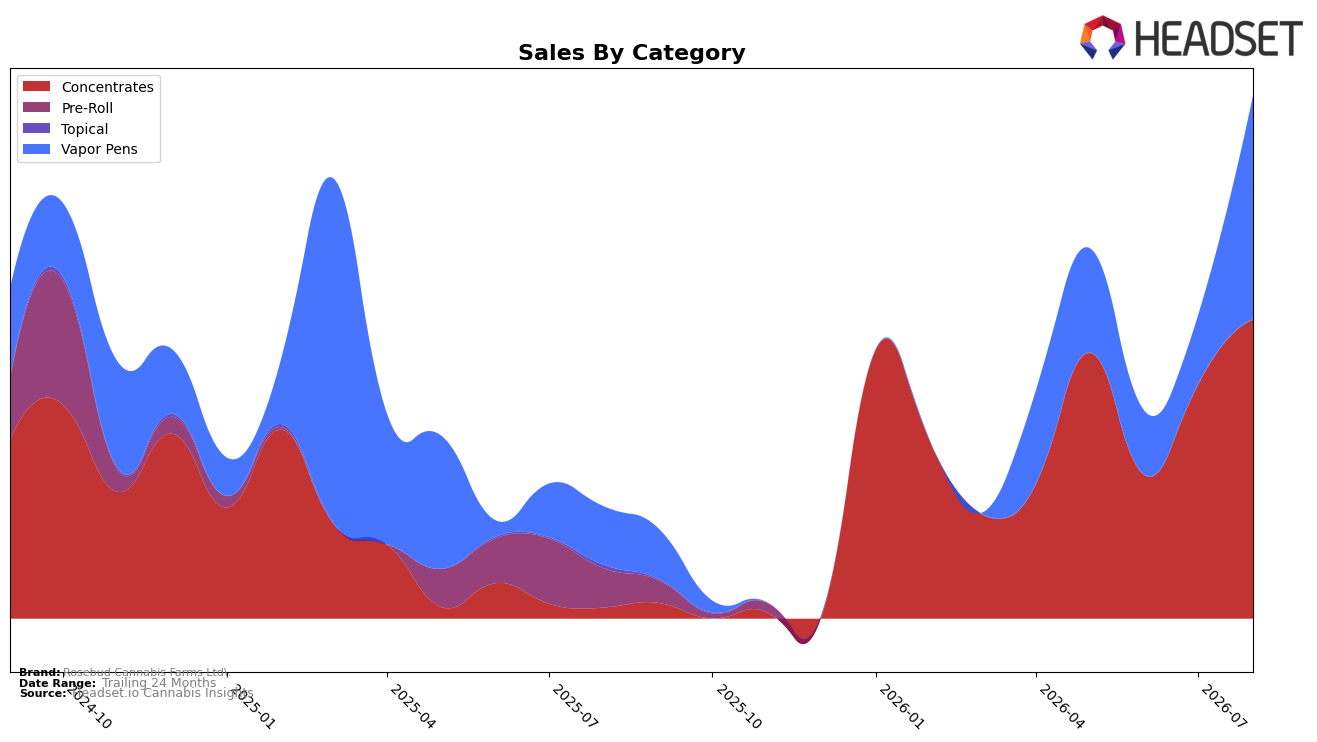
Concentrates accounted for 57.17% share in August 2026 with year-over-year growth of 2,661.12% and month-over-month growth of 28.06%, while Vapor Pens held 42.83% share with 284.46% YoY and 225.83% MoM growth. Average price rose 70.60% YoY to $52.22, with Concentrates priced at $50.01 and Vapor Pens at $55.49. The category mix pivoted toward Concentrates as the largest share-holder, but the surge in Vapor Pens MoM at 225.83% versus 28.06% for Concentrates suggests a near-term rebalancing; the pattern implies Rosebud Cannabis Farms Ltd. is broadening basket reach via Vapor Pens while still anchored by Concentrates.
In British Columbia Concentrates, Rosebud Cannabis Farms Ltd. held rank 23 in August 2026, signaling mid-pack placement despite a 2,661.12% YoY surge in that category and an overall brand sales increase of 370.56% YoY. The top-category status of Concentrates alongside 42.83% share from Vapor Pens indicates a two-pillar strategy, with Vapor Pens’ 225.83% MoM growth outpacing Concentrates’ 28.06% and pressuring average price, which sits 70.60% higher YoY, to become a lever for mix-managed volume; the pattern implies the brand’s positioning is shifting from a single-category specialist toward a balanced portfolio aimed at rank gains in British Columbia.
Competitive Landscape
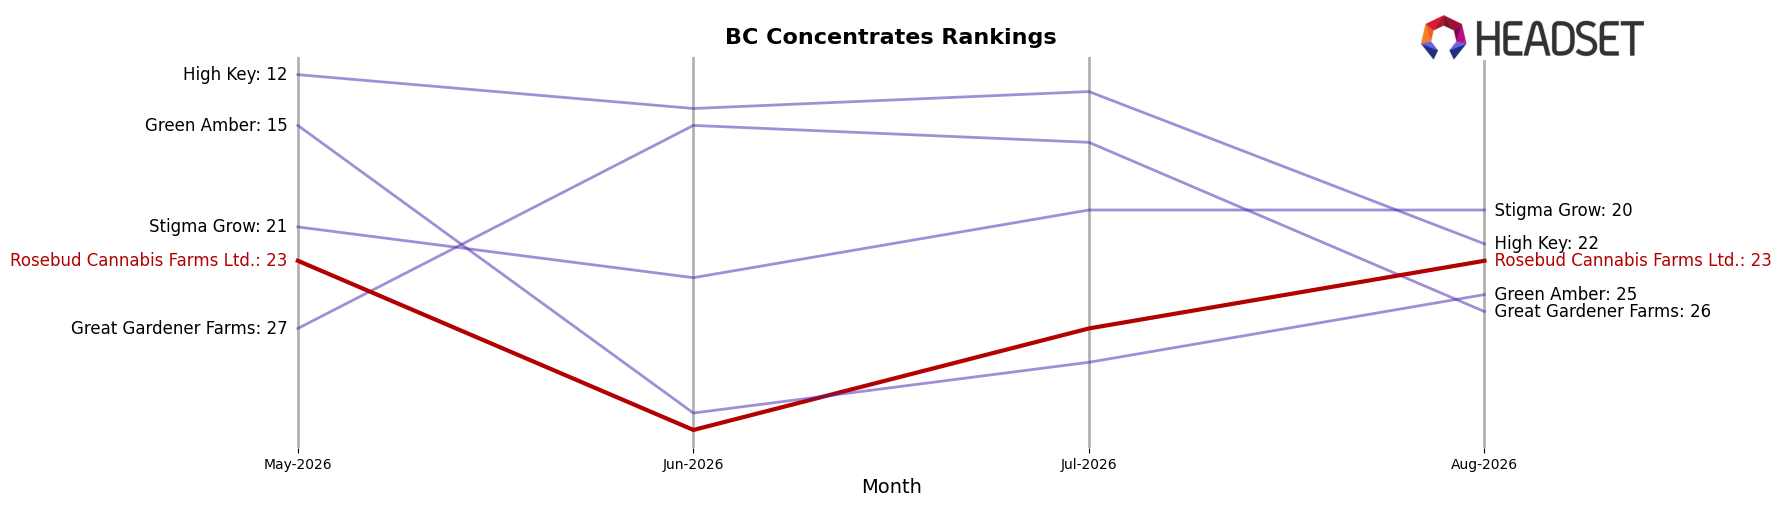
Rosebud Cannabis Farms Ltd. sits at rank #23 in BC Concentrates in August 2026 after climbing 30 places from #53 year over year, while holding flat versus May 2026 at #23 but still below its peak of #19 from January 2026; meanwhile, Dab Bods advanced from #4 to #1 with 127.2% YoY sales growth and BoxHot moved from #7 to #2 with 161.9% YoY, outpacing Rosebud’s rank recovery as Vortex Cannabis Inc. slipped from #2 to #3 with a 10.4% YoY decline and Endgame fell from #1 to #4 with a 50.3% YoY drop; the pattern implies Rosebud’s step-change in rank is stabilizing around the low-20s, signaling share gains are coming from displaced incumbents rather than dislodging the current top two.
Notable Products
Guava Gas 2.0 Live Rosin Disposable (1g) posted the standout movement in August 2026 with a 315.4% month-over-month surge and entered the top tier at a shared rank position of 3, while BC Sherbert Live Rosin Cartridge (1g) also spiked 220.5% to rank 3, indicating Vapor Pens are eclipsing prior Concentrates leaders. In contrast, Sherbert Live Rosin (1g) fell 62.9% to rank 5 and BC Garlic Papaya Live Rosin Cartridge (1g) dropped 70.1% to rank 6, a sharp bifurcation as Guava Gas 2.0 Live Rosin (1g) climbed 94.3% to rank 1. With three of the top six SKUs concentrated in Vapor Pens, the mix is tilting toward solventless rosin formats in inhalable hardware, implying Rosebud Cannabis Farms Ltd. is shifting assortment and demand capture from jars to carts and disposables rather than expanding breadth across strain families.
Top Selling Cannabis Brands






Data for this report comes from real-time sales reporting by participating cannabis retailers via their point-of-sale systems, which are linked up with Headset’s business intelligence software. Headset’s data is very reliable, as it comes digitally direct from our partner retailers. However, the potential does exist for misreporting in the instance of duplicates, incorrectly classified products, inaccurate entry of products into point-of-sale systems, or even simple human error at the point of purchase. Thus, there is a slight margin of error to consider. Brands listed on this page are ranked in the top twenty within the market and product category by total retail sales volume.

