May-2026
Sales
Trend
6-Month
Product Count
SKUs
Avg Price
YoY Sales Change
YoY Price Change
Market Insights Snapshot
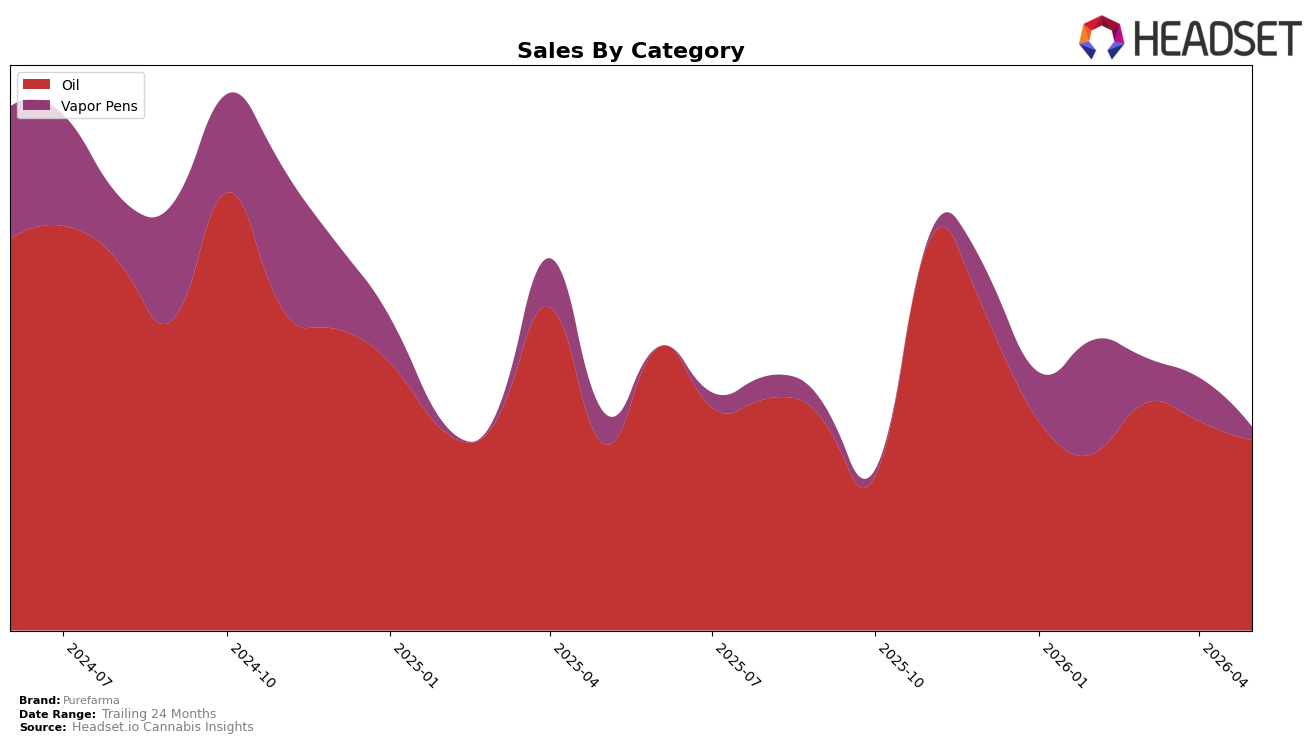
In May 2026, Purefarma concentrated 77.52% of sales in Oil with a month-over-month decline of 7.21% but a year-over-year increase of 1.36%, while Vapor Pens held 22.48% share with a 29.30% MoM drop and a 20.01% YoY decline; the net effect was a brand-level YoY sales change of -4.39% alongside a -1.19% YoY move in average price. With Oil anchoring the mix and Vapor Pens retrenching, the category tilt deepened toward Oil as Purefarma’s top category, implying a volume-stable but price-sensitive core supported by British Columbia leadership in Oil ranked 8th, where a single-category gain of 1.36% YoY offsets a sharper 29.30% MoM contraction in the secondary category.
The shift signals a positioning that leans into Oil defensibility rather than portfolio breadth: maintaining rank 8 in Oil in British Columbia while the brand’s 24-month sales at -57.83% and May 2026 MoM softness in both Oil (-7.21%) and Vapor Pens (-29.30%) suggest dependence on a single category for steadier YoY outcomes. With Oil pricing at $28.42 versus Vapor Pens at $25.81 and the brand’s average price down 1.19% YoY, Purefarma is trading value for share retention in its anchor category, indicating that near-term gains will come more from share resilience in rank 8 Oil than from recovery in the 22.48% Vapor Pens segment.
Competitive Landscape
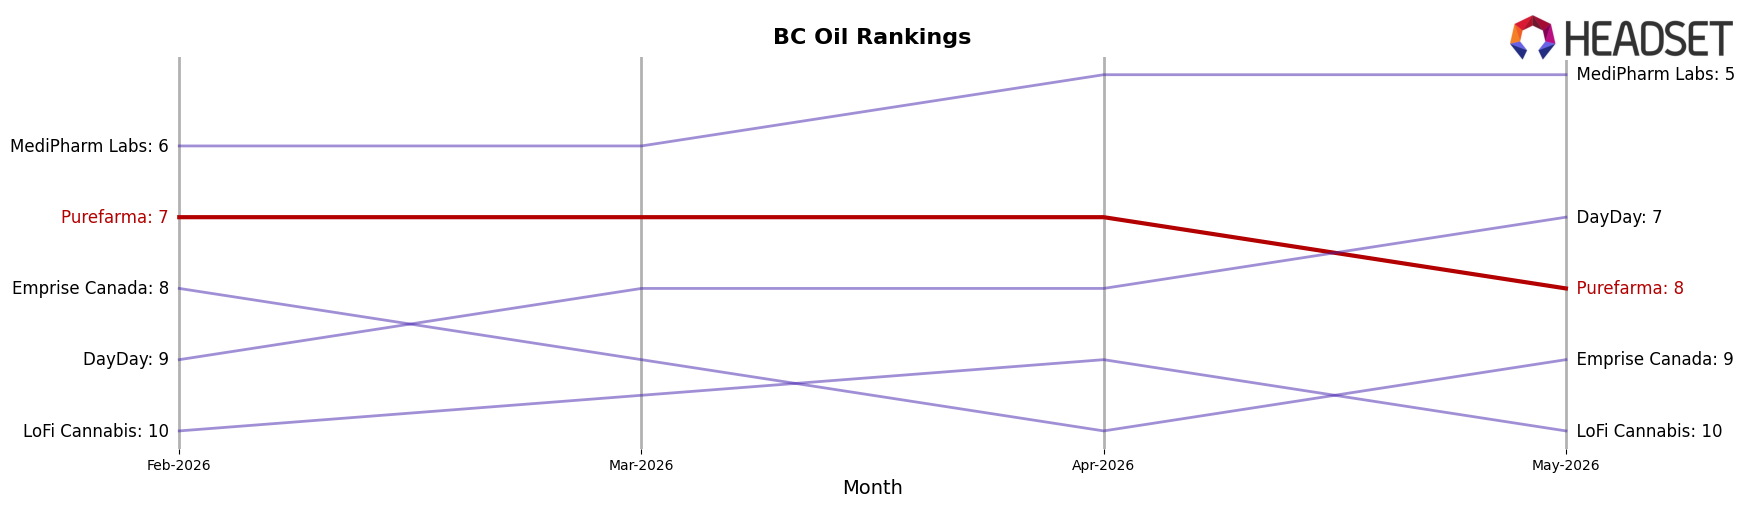
Purefarma sits at rank #8 in BC Oil for May 2026, down 1 position year over year from #7, and 1 position lower than February 2026 when it was also #7, while still two spots off its peak rank of #6 from November 2025; in contrast, Glacial Gold held #1 year over year with a 20.36% sales increase and maintained #1 in May 2026, and NightNight climbed from #6 to #3 with 81.69% YoY sales growth, outpacing Purefarma’s flat-to-declining rank momentum. With Pura Vida steady at #2 alongside 37.55% YoY sales growth and MediPharm Labs static at #5 despite a -5.16% YoY sales change, Purefarma’s slip from #7 to #8 and lack of upward movement over the past three months imply a gradual loss of competitive position as faster-rising peers consolidate share.
Notable Products
CBD Earth Full Spectrum Cartridge (1g) posted the steepest decline in May 2026 at -29.3% MoM while slipping to rank 2, whereas CBD Hemplixir 30 Oil (30ml) held rank 1 despite a -6.2% MoM dip. Hemplixir 100 CBD Oil (30ml) fell -15.7% MoM at rank 3, and two of the top three SKUs are Oils, indicating concentration in tincture formats over inhalables. The absence of sales for CBD Earth Full Spectrum Disposable (1g) alongside the -29.3% drop in the Cartridge suggests Vapor Pens are losing share to Oils, implying Purefarma’s commercial emphasis is consolidating around CBD oil staples rather than expanding inhalable variants.
Top Selling Cannabis Brands
Data for this report comes from real-time sales reporting by participating cannabis retailers via their point-of-sale systems, which are linked up with Headset’s business intelligence software. Headset’s data is very reliable, as it comes digitally direct from our partner retailers. However, the potential does exist for misreporting in the instance of duplicates, incorrectly classified products, inaccurate entry of products into point-of-sale systems, or even simple human error at the point of purchase. Thus, there is a slight margin of error to consider. Brands listed on this page are ranked in the top twenty within the market and product category by total retail sales volume.

