Jun-2026
Sales
Trend
6-Month
Product Count
SKUs
Avg Price
YoY Sales Change
YoY Price Change
Market Insights Snapshot
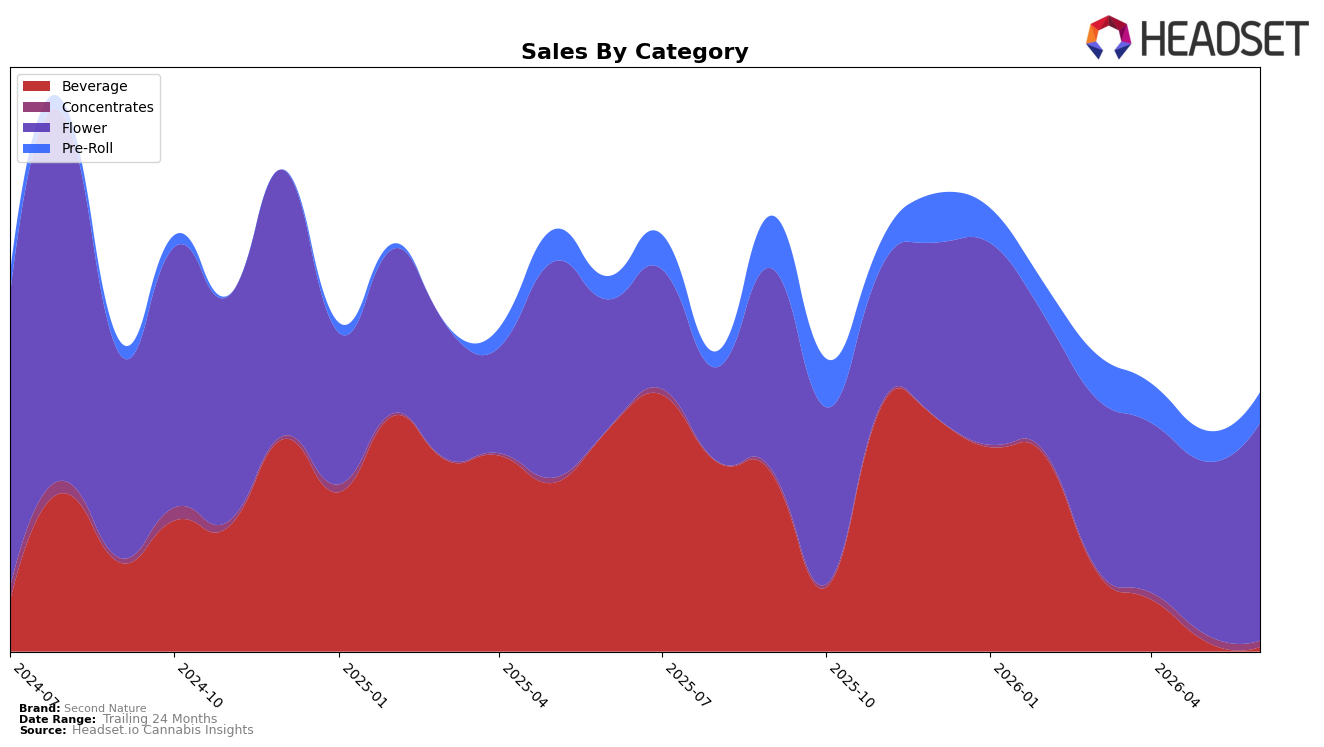
Second Nature’s category mix in June 2026 is concentrated in Flower at 84.15% share with year-over-year growth of 68.50% and month-over-month growth of 26.10%, while Pre-Roll holds 11.87% share with a 33.10% YoY increase but a -0.77% MoM dip. Concentrates is small at 2.37% share yet posts a 1,239.69% YoY surge alongside a -10.17% MoM pullback, and Beverage has contracted to 1.62% share with -98.11% YoY and -59.52% MoM. Despite overall brand sales down 31.05% YoY, the pivot toward higher-priced Flower (average price $24.63) and away from Beverage indicates a deliberate reweighting toward categories with momentum at the expense of legacy Beverage exposure in British Columbia.
The shift implies repositioning toward premiumized inhalables: Flower’s rising share and pricing coincide with a 94.08% YoY increase in the brand’s overall average price, while Pre-Roll’s slight MoM softness and Beverage’s collapse suggest deprioritization of value-oriented formats. Concentrates’ outsized 1,239.69% YoY from a 2.37% base, paired with a -10.17% MoM, points to test-and-scale behavior rather than a core pillar, whereas Flower’s 26.10% MoM lift and 84.15% share signal a volume-led anchor. The pattern implies Second Nature is trading up on mix to defend margin and share within British Columbia even as total brand sales decline 31.05% YoY.
Competitive Landscape
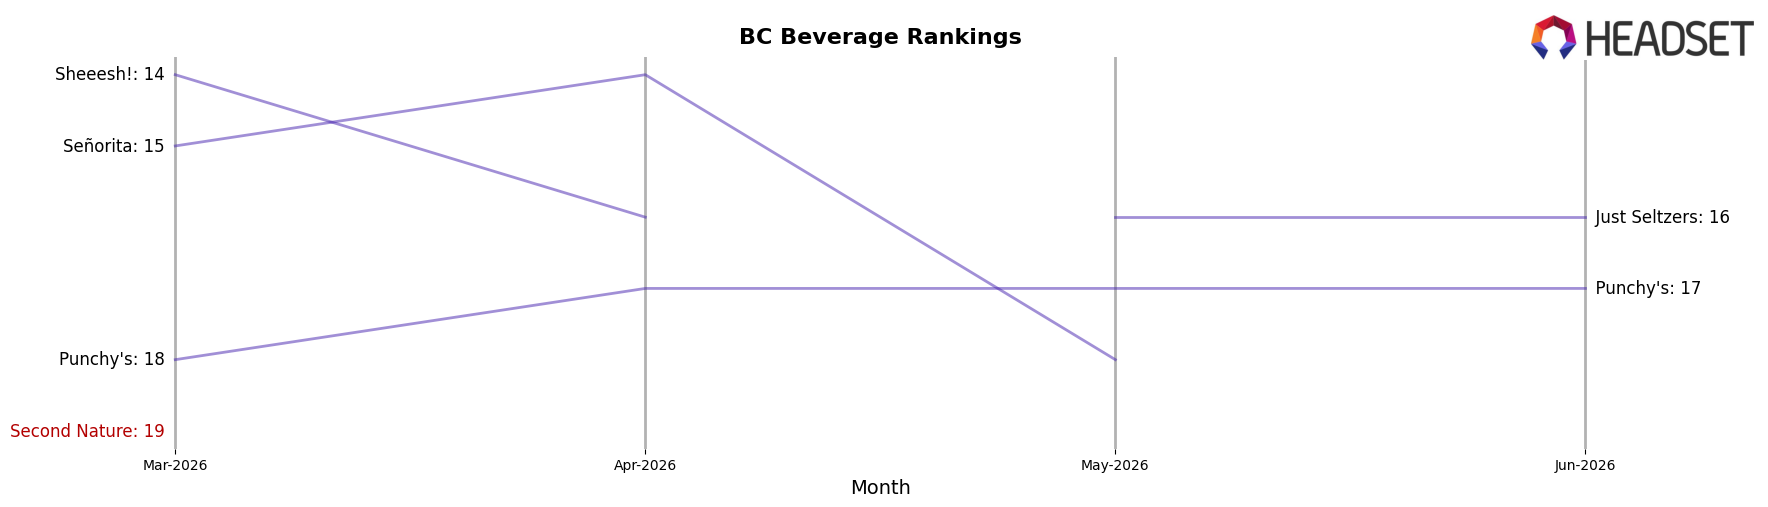
Second Nature sits at #24 in BC Beverage in June 2026, down 10 ranks year over year from #14 and slipping 5 positions since March 2026 from #19, while its peak of #12 in November 2025 indicates a 12-place fall from that high; by contrast, Mollo climbed from #4 to #2 with 68.9% year-over-year sales growth and Sweet Justice fell from #1 to #4 alongside an 18.7% sales decline, signaling that Second Nature’s downward rank trajectory is less about across-the-board market compression and more about being outpaced by faster risers at the top tier.
Notable Products
Senorita - Mango Mexican Agave Lime Margarita Drink (10mg THC, 12oz) posted the sharpest move in June 2026 with a -59.5% MoM drop to rank 6, while Sub Zero (3.5g) fell -51.2% to rank 3, indicating demand swung away from non-Flower formats and select legacy Flower SKUs. In contrast, Blueberry Cheesecake (3.5g) surged +52.8% MoM to rank 1 and Bottomless Mimosa (3.5g) rose +18.3% to rank 2, and four of the top ten are Flower SKUs concentrated in 3.5g sizes, implying assortment gravity is consolidating around core inhalables even as beverages retrench. The Blueberry Cheesecake Pre-Roll (1g) at rank 5 declined -14.2% MoM, while the Blueberry Cheesecake Pre-Roll 5-Pack (5g) entered at rank 8 with $1,069, suggesting single-stick softness alongside multi-pack trial as consumers trade toward value within the same strain family. Taken together, steep declines in beverage and selective Flower alongside gains in flagship 3.5g Flower indicate Second Nature’s product mix is tilting toward high-velocity core strains and multi-pack value propositions over ancillary formats.
Top Selling Cannabis Brands
Data for this report comes from real-time sales reporting by participating cannabis retailers via their point-of-sale systems, which are linked up with Headset’s business intelligence software. Headset’s data is very reliable, as it comes digitally direct from our partner retailers. However, the potential does exist for misreporting in the instance of duplicates, incorrectly classified products, inaccurate entry of products into point-of-sale systems, or even simple human error at the point of purchase. Thus, there is a slight margin of error to consider. Brands listed on this page are ranked in the top twenty within the market and product category by total retail sales volume.

