Jun-2026
Sales
Trend
6-Month
Product Count
SKUs
Avg Price
YoY Sales Change
YoY Price Change
Market Insights Snapshot
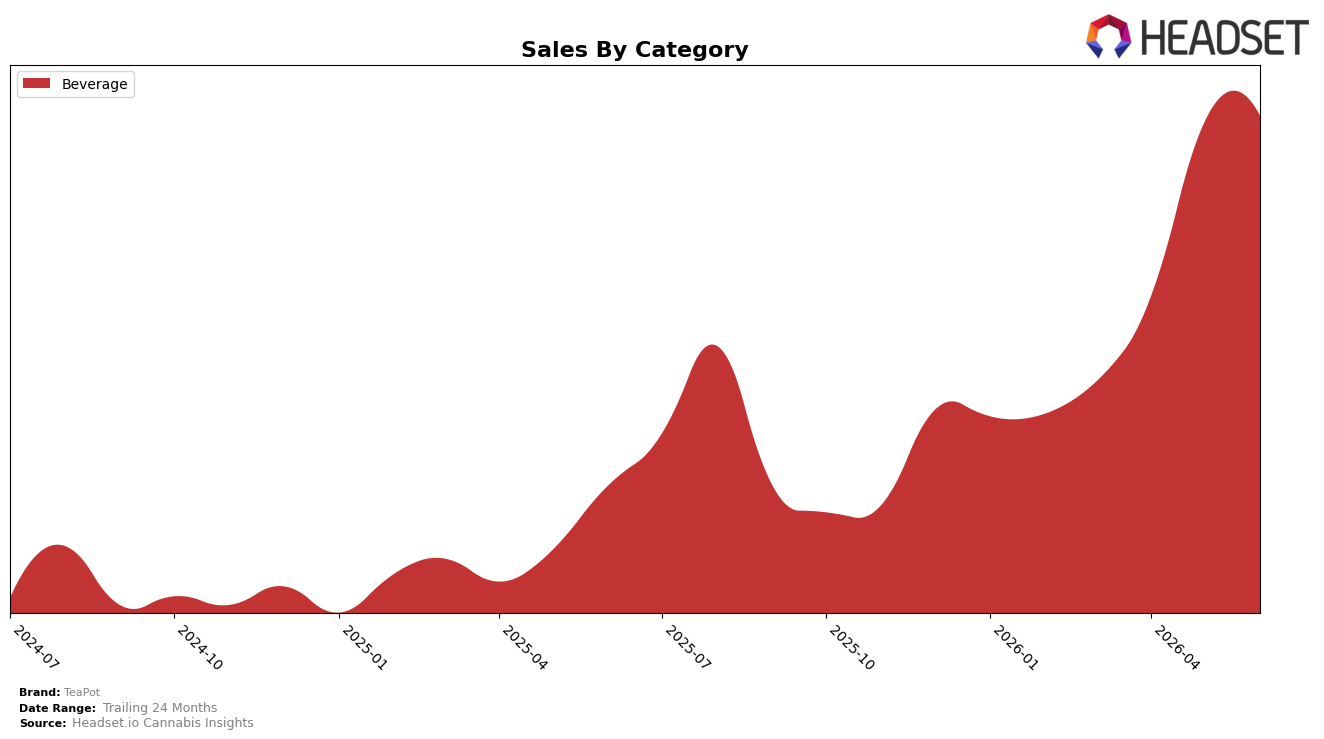
In June 2026, TeaPot operated as a single-category brand with Beverage at 100.0% of mix, posting 117.31% year-over-year growth alongside a 0.90% month-over-month uptick, while average price fell 8.65% year-over-year. Within the Ontario Beverage context, TeaPot held rank 5 as of June 2026, a position that coexists with a 220.28% 24-month expansion and a stable month-over-month volume signal implied by modest growth despite lower pricing. The pattern implies TeaPot is trading price for velocity within Beverage and concentrating fully in that lane to sustain share gains without relying on category diversification.
The mix locked at 100.0% Beverage combined with a -8.65% average price shift and a 117.31% sales increase indicates TeaPot’s positioning leans into accessibility to widen penetration rather than premium-tier stretch, and the 0.90% month-over-month growth alongside rank 5 suggests headroom if pricing strategy continues to convert. With Ontario as the top market and Beverage as the top category, the 220.28% 24-month rise alongside rank 5 signals a scale-first posture where incremental price recovery could lift revenue without eroding the demand response that delivered triple-digit year-over-year growth. The implication is that TeaPot’s near-term leverage comes from maintaining Beverage-led breadth while testing selective price normalization to improve yield per unit while protecting velocity.
Competitive Landscape
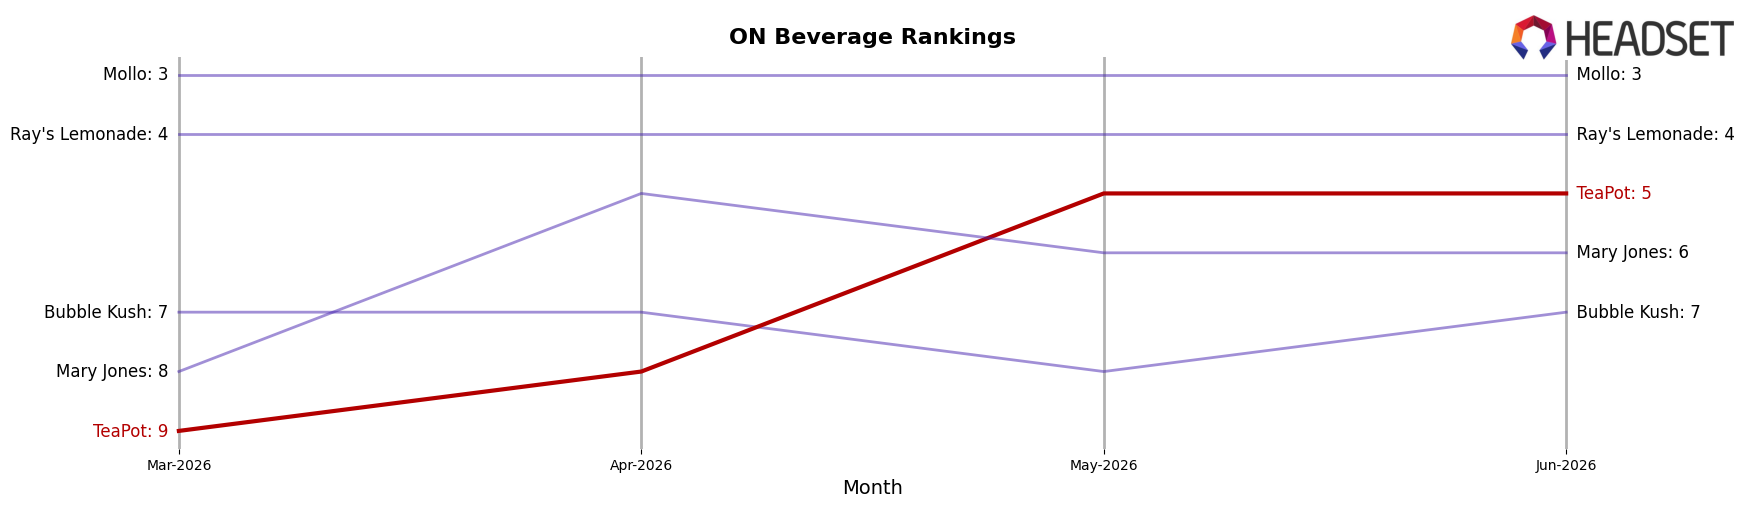
TeaPot is currently ranked #5 in ON Beverage in June 2026, improving 5 positions year over year from #10 and rising 4 spots since March 2026 from #9, while also matching its peak rank at #5 in June 2026; in contrast, XMG held at #1 year over year but posted a 37.0% sales decline and Ray's Lemonade advanced from #5 to #4 with 23.5% YoY sales growth, indicating TeaPot’s rank gains are coming amid mixed top-tier momentum and suggesting the trajectory points to share capture from weakening leaders rather than pure category expansion.
Notable Products
Good Day - Peach Black Rosin Infused Tea (10mg THC, 12oz, 355ml) posted the steepest decline at -10.3% MoM while holding rank 1, and Good Day - Lemon Black & Pedro's Sweet Sativa Iced Tea (5mg THC, 12oz) climbed 20.5% MoM at rank 2, indicating shopper trade-down from a higher-dose leader toward a lower-dose citrus variant. Meanwhile, CBG/THC 1:1 Raspberry Black Rosin Infused Tea (10mg CBG, 10mg THC, 30mg Caffeine, 355ml) in rank 3 barely moved at +0.6% MoM as evening-positioned SKUs rose 34.4% and 14.2% MoM at ranks 7 and 8, pointing to momentum in functional or time-of-day formats. With all top 10 positions in Beverage and four of the top five anchored by lemon or citrus profiles, the mix implies TeaPot is concentrating demand around citrus-led refreshment and lighter-dose daytime occasions, shifting emphasis away from a single high-dose flagship.
Top Selling Cannabis Brands
Data for this report comes from real-time sales reporting by participating cannabis retailers via their point-of-sale systems, which are linked up with Headset’s business intelligence software. Headset’s data is very reliable, as it comes digitally direct from our partner retailers. However, the potential does exist for misreporting in the instance of duplicates, incorrectly classified products, inaccurate entry of products into point-of-sale systems, or even simple human error at the point of purchase. Thus, there is a slight margin of error to consider. Brands listed on this page are ranked in the top twenty within the market and product category by total retail sales volume.

