Market Insights Snapshot
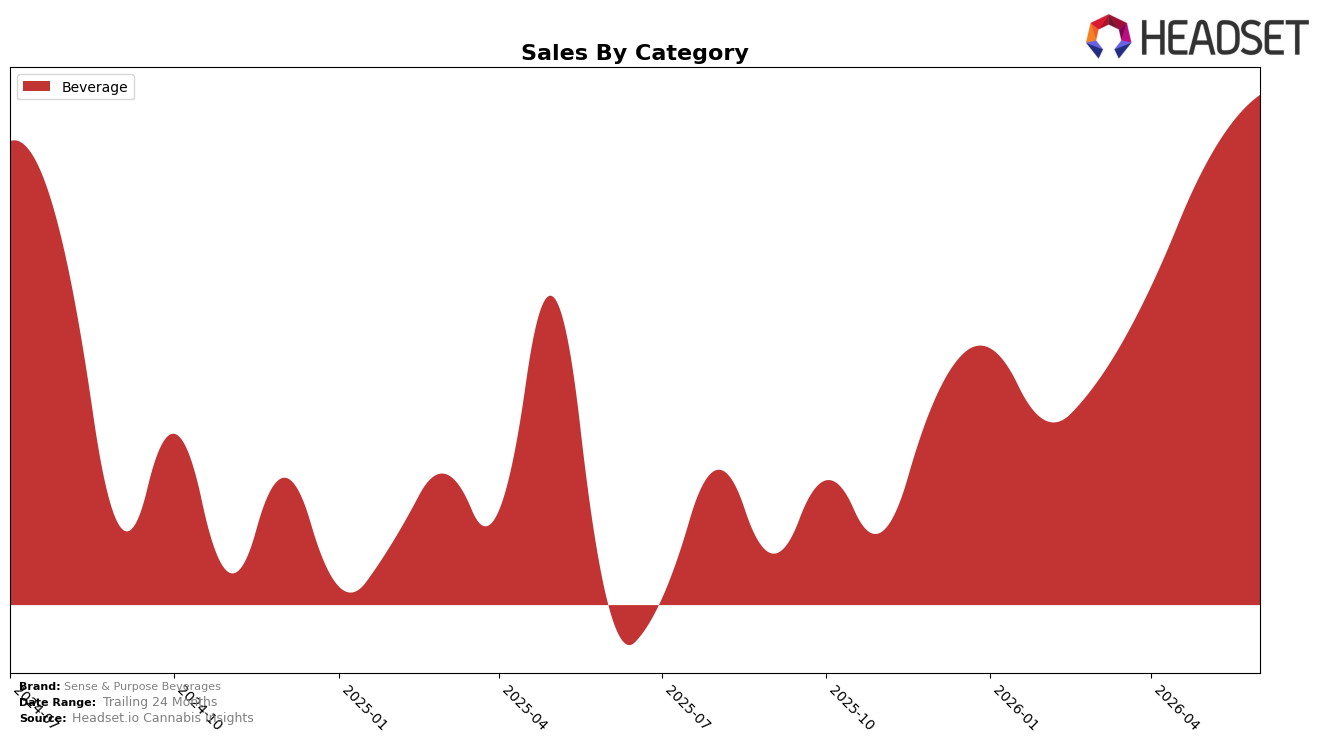
In June 2026, Sense & Purpose Beverages concentrated 100.0% of sales in Beverage, with year-over-year growth of 59.12% alongside a month-over-month increase of 5.52%. Average price declined 6.71% YoY while sales advanced, and the brand held rank 5 in Beverage within Alberta. The pattern implies volume-led expansion in a single-category footprint where price elasticity supported a 59.12% YoY lift despite a 6.71% YoY price drop, and the 5.52% MoM uptick suggests the current price-to-demand balance is still accretive to share and rank.
With a 100.0% category concentration and a rank of 5 in Beverage in Alberta, the 59.12% YoY sales rise against a 6.71% YoY price cut points to a trade-off favoring unit velocity over margin per unit. The 5.52% MoM growth during June 2026, combined with a 24-month sales change of 5.08%, indicates near-term momentum outpacing longer-run gains, implying the brand’s positioning is shifting toward price-accessible Beverage offerings that prioritize incremental basket conversion over premiumization.
Competitive Landscape
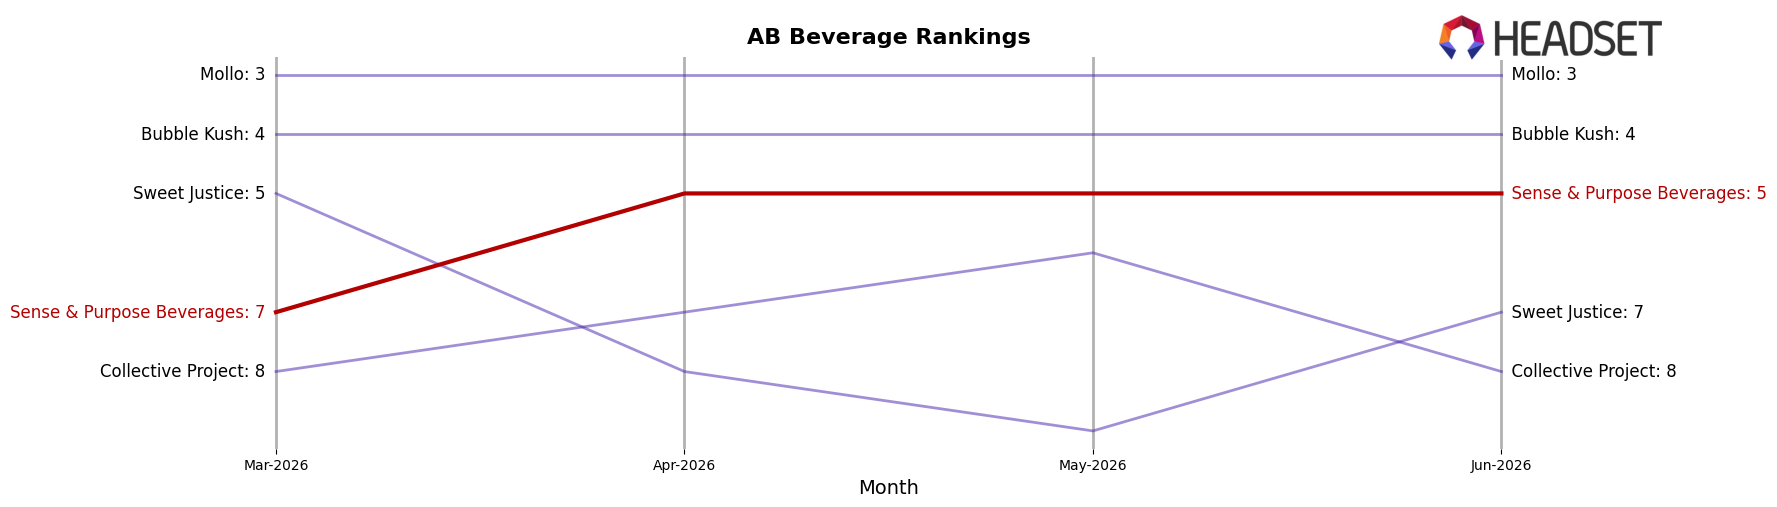
Sense & Purpose Beverages is ranked #5 in AB Beverage in June 2026, improving 3 positions year over year from #8 and rising 2 positions versus March 2026 from #7, marking a new peak rank of #5 in June 2026. Against peers, XMG held at #1 year over year while its sales declined 18.9%, and Mary Jones climbed from #4 to #2 with 177.5% sales growth; additionally, Mollo slipped from #2 to #3 with a 17.4% sales drop while Bubble Kush advanced from #7 to #4 on 62.4% growth. The mix of Sense & Purpose Beverages moving from #8 to #5 while incumbents at #1 and #3 showed double‑digit sales declines implies the brand’s rank trajectory is benefiting from competitor softness and momentum among mid-tier risers, positioning it to contest #4 next if current shifts persist.
Notable Products
Relax- CBD/THC 1:1 Grapefruit Yuzu Sparkling Water & Juice ( 5mg CBD, 5mg THC, 355ml) led June 2026 with +11.7% MoM and held rank 1, while Recharge - CBD/THC 1:1 Orange, Pineapple & Passionfruit Sparking Water and Juice (10mg CBD, 10mg THC, 355ml) slipped 1.2% and sat at rank 2. Refocus - CBD/THC 10:1 Green Tea Lemonade Ginger Sparkling Beverage (20mg CBD, 2mg THC, 355ml) rose 6.3% at rank 3, and all three top-3 positions are Beverage SKUs, indicating full category concentration in the top tier. The gap between rank 1 and rank 2 widened as Relax advanced double digits while Recharge contracted, despite both being 355ml 1:1 offerings with shared format, with rank stability masking diverging MoM trajectories. This pattern implies Sense & Purpose Beverages is consolidating around Beverage-led, CBD/THC ratio variants where 1:1 and 10:1 formats define demand, pointing the commercial direction toward mix optimization within a single category rather than portfolio expansion.
Top Selling Cannabis Brands
Data for this report comes from real-time sales reporting by participating cannabis retailers via their point-of-sale systems, which are linked up with Headset’s business intelligence software. Headset’s data is very reliable, as it comes digitally direct from our partner retailers. However, the potential does exist for misreporting in the instance of duplicates, incorrectly classified products, inaccurate entry of products into point-of-sale systems, or even simple human error at the point of purchase. Thus, there is a slight margin of error to consider. Brands listed on this page are ranked in the top twenty within the market and product category by total retail sales volume.

