.svg)


Where to Buy
Silver Lake is stocked at 37 licensed dispensaries across Colorado, with the deepest coverage in Denver, Pueblo West, Aurora, Commerce City, and Durango. Search by ZIP code or city below to find the closest one.
Market Insights Snapshot
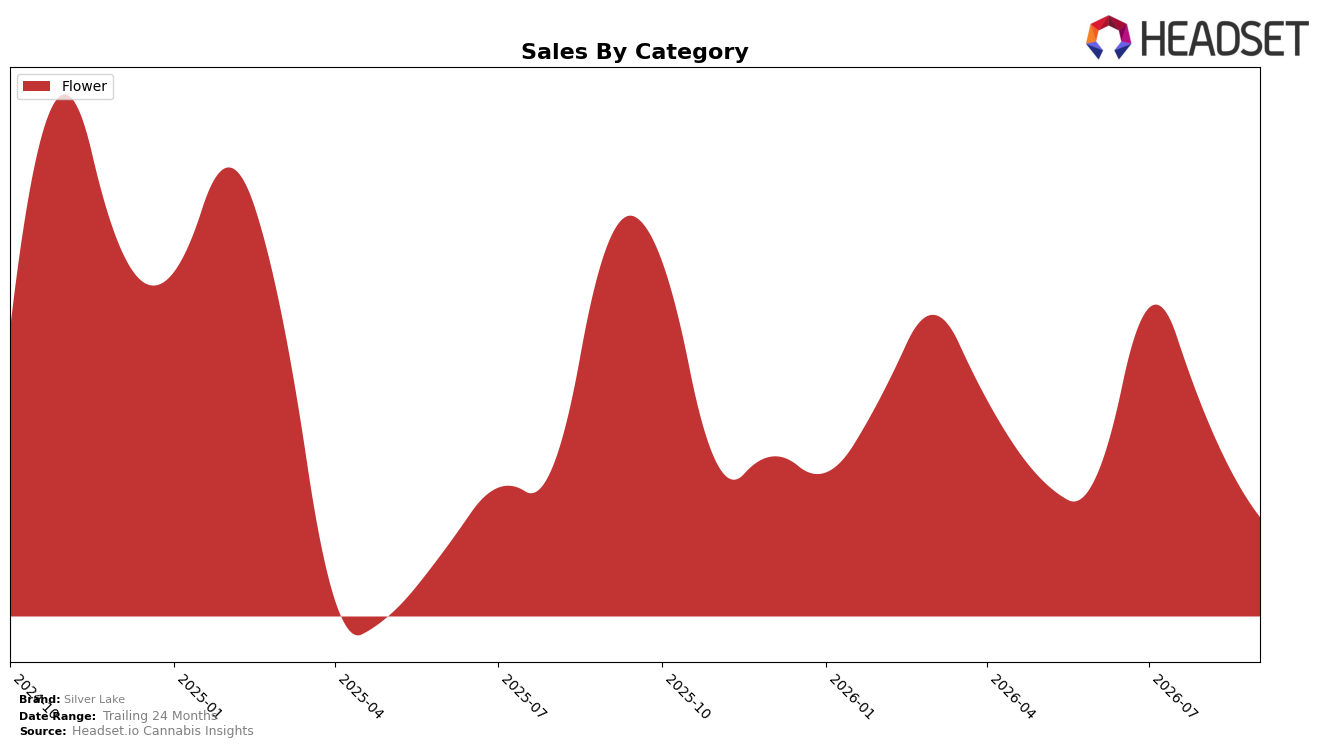
In September 2026, Silver Lake concentrated 100.0% of sales in Flower, with year-over-year sales down 48.19% and month-over-month down 26.08%, while average price declined 17.20% YoY and the 24‑month sales trend was down 7.92%. Within Colorado Flower, the brand sat at rank 22, indicating a lower-tier position despite a single-category focus; the combination of a 26.08% MoM contraction and a 48.19% YoY decline implies the current assortment is overexposed to category-level volatility and price compression.
With all revenue tied to Flower and September 2026 pricing down 17.20% YoY against a 48.19% sales decline, mix is not cushioning volume loss and the rank at 22 suggests limited shelf leverage relative to higher-ranked peers. The 26.08% MoM drop alongside a 7.92% decline over 24 months indicates a recent acceleration of pressure, implying that Silver Lake’s positioning is skewed toward lower-priced Flower SKUs that are not converting to share gains in Colorado, and that diversification or premiumization within Flower would be required to stabilize rank and mitigate sensitivity to price swings.
Competitive Landscape
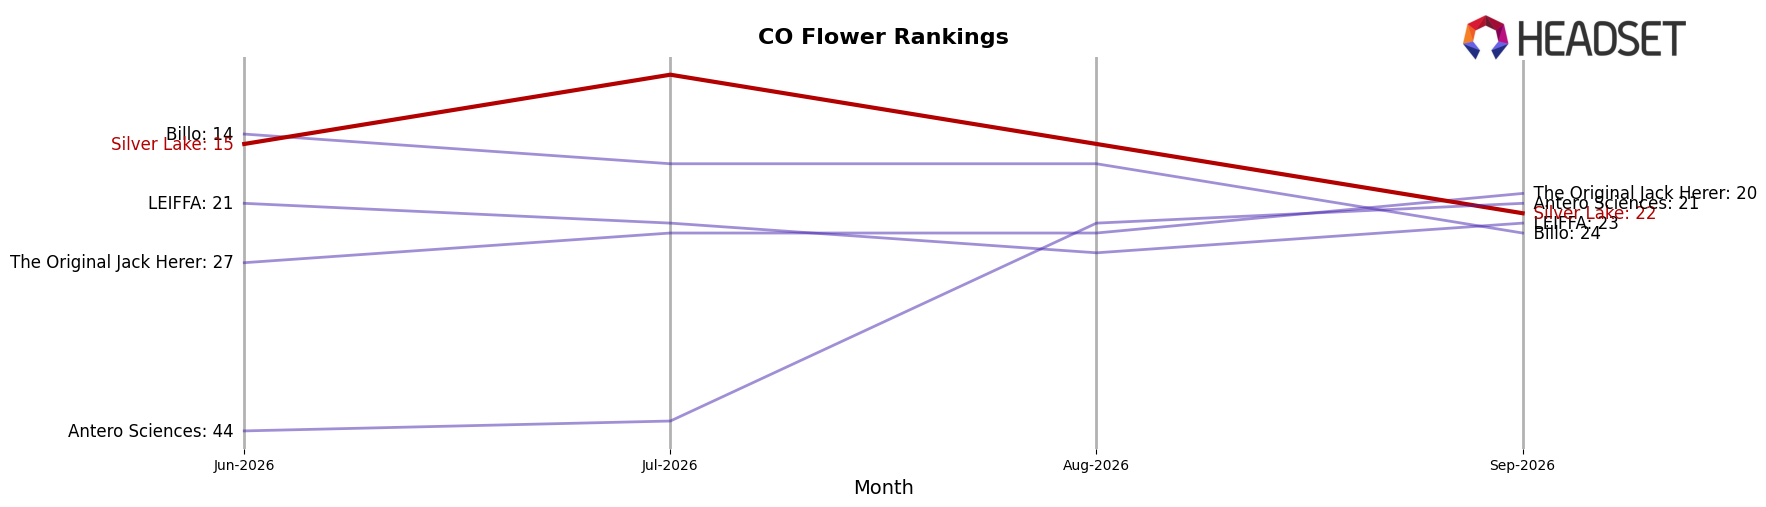
Silver Lake sits at rank #22 in CO Flower in September 2026, down 16 places from #6 year over year, and 7 places below its June 2026 position at #15; by contrast, Green Label Cannabis held #1 after a 0-place YoY change with sales up 38.0%, while Good Chemistry Nurseries moved from #3 to #2 on 45.5% YoY growth—both outpacing Silver Lake’s slide from a peak of #4 in February 2025 to outside the top 20 by September 2026. With In The Flow jumping from #12 to #5 alongside 113.5% YoY sales growth and Green Dot Labs improving from #4 to #3 on 33.4% growth, the directional gap suggests Silver Lake’s rank trajectory implies share is consolidating among faster-rising competitors and a near-term return to top-10 standing is unlikely without a reversal in momentum.
Notable Products
Lemon Pound Cake (Bulk) posted the steepest decline in September 2026 at -78.3% MoM while dropping outside the top five to rank 6, and Fruity Pebbles OG (Bulk) fell -67.0% MoM at rank 5. Orange Push Pop (Bulk) also contracted -31.3% MoM yet held rank 1, whereas Fruity Pebbles (Bulk) slid -50.2% MoM at rank 10. With eight of the top ten positioned in Bulk Flower and only one 1g SKU in the set, the mix points to concentration in large-format Flower even as volatility at ranks 5–10 suggests price- or inventory-led pruning of slower variants.
LA Kush Cake (Bulk) was a counterweight with +19.2% MoM at rank 3, but Sour Patch Kids (Bulk) dropped -49.4% MoM at rank 9 against a median trajectory skewed negative. The spread between rank 1 and rank 3 includes a dollar gap of $4,886 this month, and four SKUs in ranks 5–10 each declined by at least -49.4% MoM. The pattern implies Silver Lake is leaning into a few resilient Bulk Flower leaders while letting tail SKUs cycle down, consolidating demand into higher-velocity strains.
Top Selling Cannabis Brands






Data for this report comes from real-time sales reporting by participating cannabis retailers via their point-of-sale systems, which are linked up with Headset’s business intelligence software. Headset’s data is very reliable, as it comes digitally direct from our partner retailers. However, the potential does exist for misreporting in the instance of duplicates, incorrectly classified products, inaccurate entry of products into point-of-sale systems, or even simple human error at the point of purchase. Thus, there is a slight margin of error to consider. Brands listed on this page are ranked in the top twenty within the market and product category by total retail sales volume.

