Market Insights Snapshot
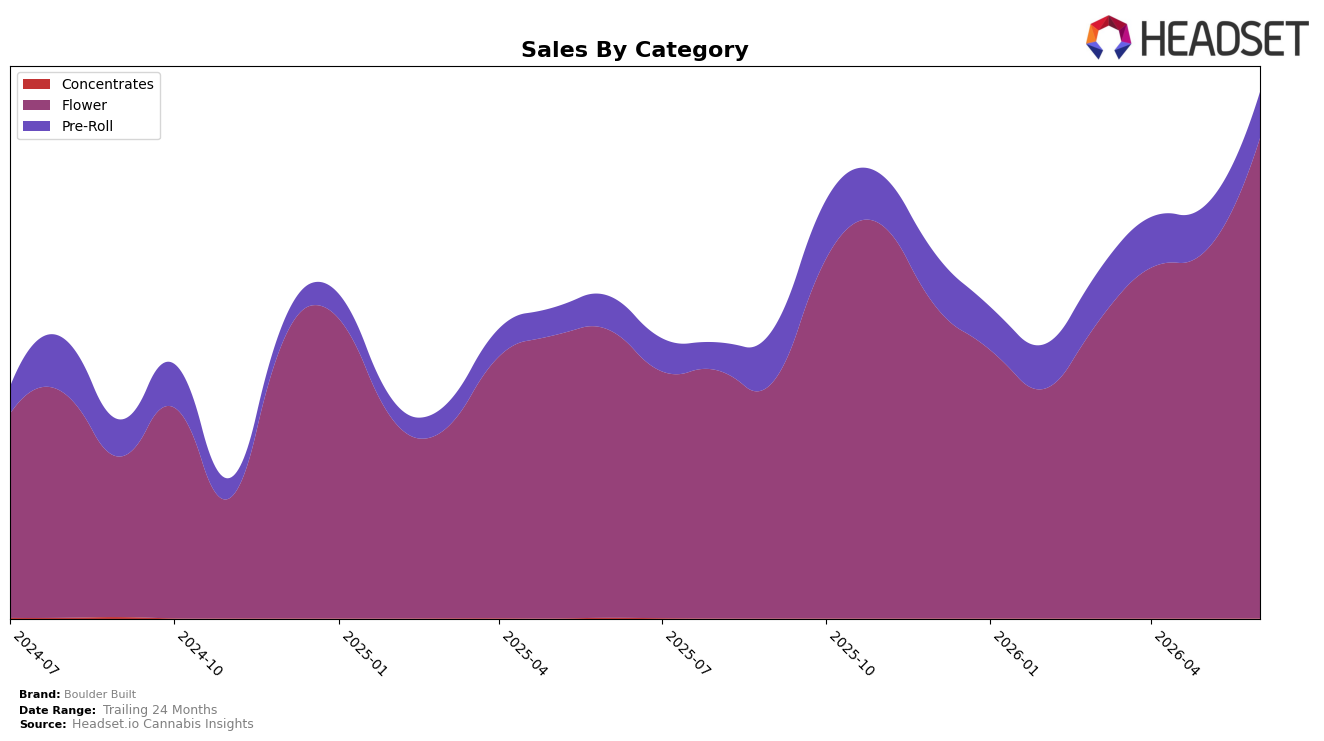
In June 2026, Boulder Built derived 91.30% share from Flower and 8.70% from Pre-Roll, with Flower up 66.80% year over year and 31.04% month over month while Pre-Roll rose 36.69% year over year and 0.61% month over month; the brand’s overall sales were up 63.33% year over year alongside a 19.16% decline in average price. Within Flower, average price sat at $9.27 versus $7.49 in Pre-Roll, pointing to mix-driven volume gains as Flower’s faster month-over-month growth of 31.04% versus 0.61% in Pre-Roll pushed the category mix further toward Flower; this pattern implies Boulder Built is concentrating velocity in a single anchor category rather than broadening its portfolio.
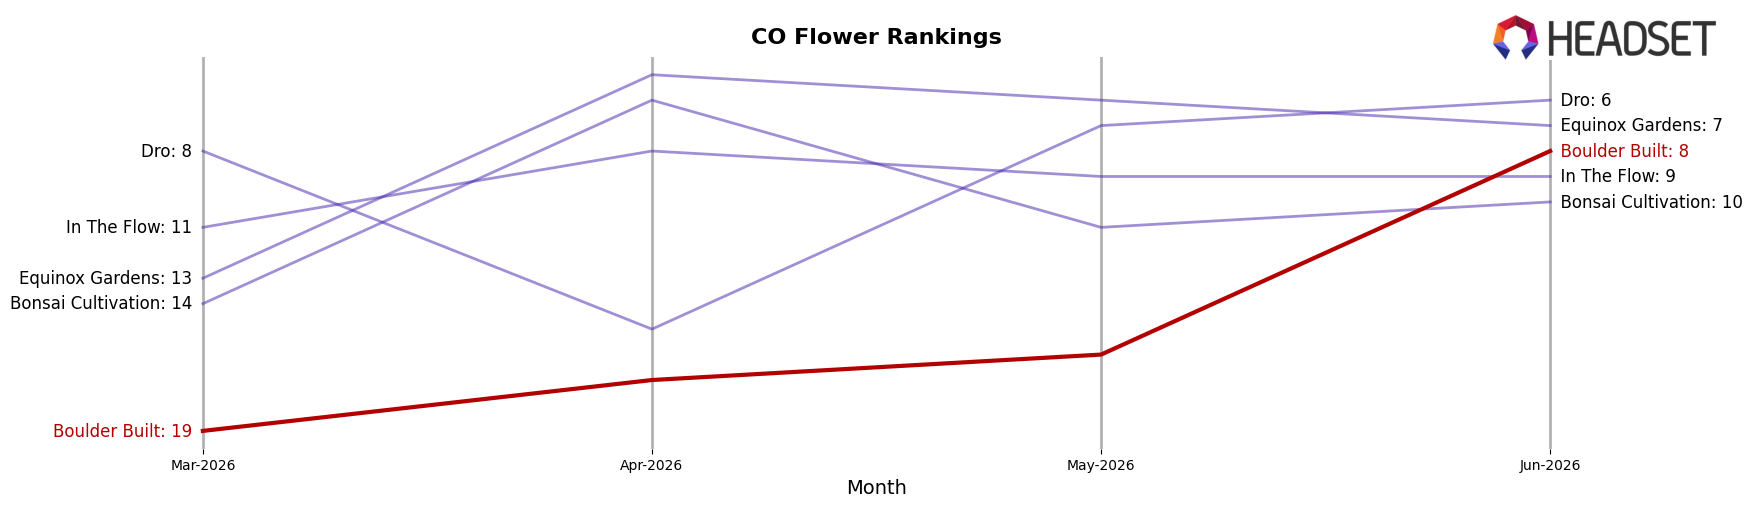
Positionally, holding Rank 8 in Flower in Colorado with a 91.30% category mix weight suggests defensible placement where incremental rank movement likely depends more on sustaining Flower’s 31.04% month-over-month trajectory than on Pre-Roll’s 0.61% lift. The combination of a 19.16% average price reduction and a 66.80% year-over-year Flower increase indicates a price-elastic, volume-led strategy that can expand share but ties brand equity to Flower cycles; this implies near-term rank stability within Flower in Colorado but limited insulation if category momentum slows.
Competitive Landscape
Boulder Built is ranked #8 in Colorado Flower in June 2026, improving 4 positions year over year from #12 while leaping 11 spots since March 2026 from #19, and hitting a peak rank of #8 in June 2026; against this, Seed & Strain Cannabis Co. moved from #2 to #1 with 62.8% YoY sales growth, and Good Chemistry Nurseries slipped from #1 to #3 with a 2.8% YoY sales decline, indicating Boulder Built’s upward mobility is tied less to absolute top-end displacement and more to mid-tier share gains that, if sustained, position it to challenge the #5–#4 tier next.
Notable Products
Pink Animal Mints Popcorn (1g) posted the standout movement in June 2026 with a +121.6% month-over-month surge to rank 1, overtaking multiple bulk Flower peers that held ranks 2 through 7; that leap, combined with eight of the top ten being Flower SKUs, signals a consolidation around value-driven inhalables. Despite Pink Animal Mints Popcorn (1g) rising to rank 1, Peanut Butter Gelato (Bulk) held a higher absolute sales base at $71,499 while sitting at rank 7, indicating mix skew toward lower-price pack sizes even as premium-volume bulk remains material. Strawberry Pines (3.5g) at rank 8 and Soap x Devil Driver (3.5g) at rank 9 keep 3.5g formats present in the top ten, but with no double-digit MoM gains reported outside the leading SKU, momentum is concentrated rather than broad-based. The pattern implies Boulder Built is tilting its commercial focus toward high-velocity Flower at accessible sizes, using a single breakout SKU to pull share while bulk formats provide a revenue floor.
Top Selling Cannabis Brands
Data for this report comes from real-time sales reporting by participating cannabis retailers via their point-of-sale systems, which are linked up with Headset’s business intelligence software. Headset’s data is very reliable, as it comes digitally direct from our partner retailers. However, the potential does exist for misreporting in the instance of duplicates, incorrectly classified products, inaccurate entry of products into point-of-sale systems, or even simple human error at the point of purchase. Thus, there is a slight margin of error to consider. Brands listed on this page are ranked in the top twenty within the market and product category by total retail sales volume.

