.svg)
Sep-2026
Sales
Trend
6-Month
Product Count
SKUs
Avg Price
YoY Sales Change
YoY Price Change


Where to Buy
Nectar is stocked at 184 licensed dispensaries across Massachusetts, Oregon, and 6 other states, 106 of them in Massachusetts, with the deepest coverage in Boston, Worcester, Brockton, Northampton, and Blackstone. Search by ZIP code or city below to find the closest one, or filter by product type if you are after a specific format.
Market Insights Snapshot
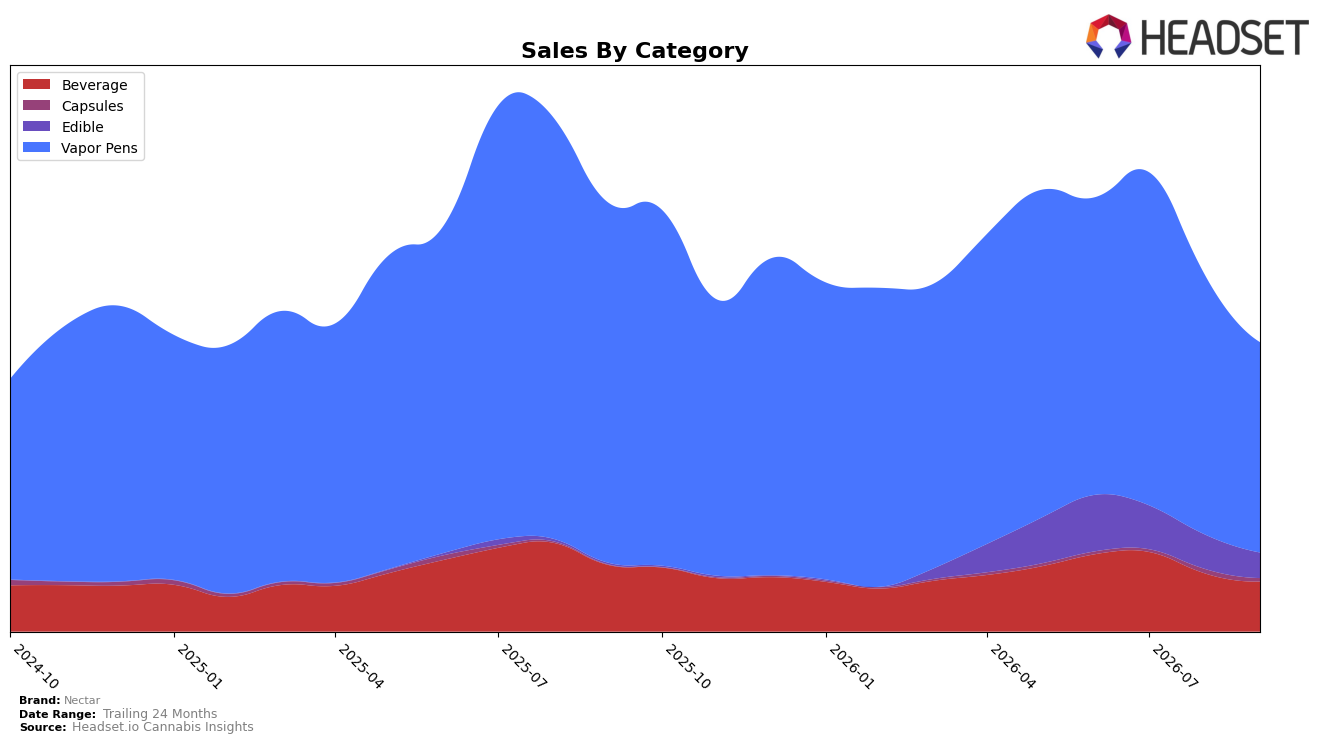
In September 2026, Vapor Pens held 72.94% share with a year-over-year decline of 41.64% and a month-over-month drop of 19.11%, while Nectar’s rank in Vapor Pens in Massachusetts sat at 35. Beverage accounted for 17.27% share with a 25.06% YoY decline and a 14.24% MoM decline, whereas Edible surged 1,949.99% YoY to 8.73% share but fell 26.26% MoM and Capsules rose 1,876.15% YoY to 1.06% share while sliding 23.94% MoM; combined with a 25.11% YoY drop in average price and a 32.67% YoY sales decline, the mix indicates heavy exposure to a contracting core and fast-growing but still small adjacencies.
The pattern implies Nectar is trading depth for breadth: the steep Vapor Pens contraction alongside triple-digit YoY gains in Edible and Capsules suggests a portfolio pivot that lifts category count but not immediate velocity, as evidenced by simultaneous MoM pullbacks of 26.26% and 23.94%. With 72.94% of sales still concentrated in Vapor Pens and a 35th-place rank in Massachusetts, the brand’s positioning is anchored in a weakening primary category while new formats provide optionality rather than scale, pointing to a need to rebalance price-pack architecture (average price down 25.11% YoY) and invest where share can convert faster than the current 8.73% and 1.06% footprints.
Competitive Landscape
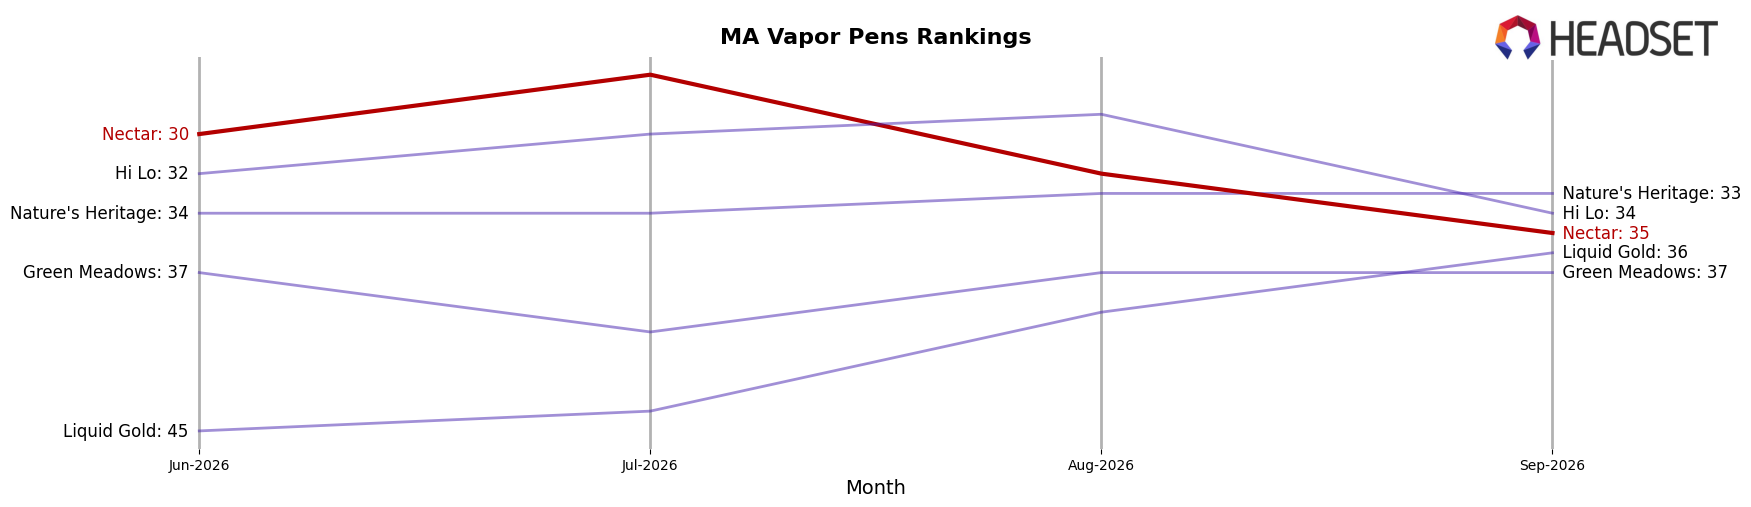
Nectar sits at rank #35 in MA Vapor Pens in September 2026, down 10 positions year over year from #25, and 5 positions lower than June 2026’s #30; relative to its peak at #20 in August 2025, the brand is 15 places off its high, while the market leader Fernway held #1 both this year and last as its sales grew 43.6% year over year, and Jeeter climbed from #23 to #4 on 421.5% sales growth. Against this backdrop, Select held #2 with an 11.7% sales decline while Dime Industries advanced from #6 to #5 on 63.0% growth, indicating that Nectar’s double-digit rank slide and three-month deterioration position it on the wrong side of a consolidation where fast risers are pulling away.
Notable Products
The steepest decline in September 2026 came from Watermelon Gelato Seltzer (5mg THC, 355ml, 12oz), down 28.6% MoM while holding rank 8, and Cherry Lime Haze Seltzer (5mg THC, 355ml, 12oz) also contracted 21.7% MoM at rank 4. Blue Raspberry Gummies 20-Pack (100mg) fell 20.7% MoM yet remained rank 1 with $9,417, and Sugar Free Blue Raspberry Runtz Seltzer (5mg THC, 355ml, 12oz) slid 18.2% MoM at rank 3. With four of the top ten coming from Beverage SKUs and posting double-digit MoM declines while Edible leaders hold ranks 1 and 2, the mix implies a pivot toward steadier Edible pull as Seltzers cycle down and Vapor Pen entries sit in the top ten without MoM momentum.
Top Selling Cannabis Brands






Data for this report comes from real-time sales reporting by participating cannabis retailers via their point-of-sale systems, which are linked up with Headset’s business intelligence software. Headset’s data is very reliable, as it comes digitally direct from our partner retailers. However, the potential does exist for misreporting in the instance of duplicates, incorrectly classified products, inaccurate entry of products into point-of-sale systems, or even simple human error at the point of purchase. Thus, there is a slight margin of error to consider. Brands listed on this page are ranked in the top twenty within the market and product category by total retail sales volume.

