.svg)

Sep-2026
Sales
Trend
6-Month
Product Count
SKUs
Avg Price
YoY Sales Change
YoY Price Change


Where to Buy
Sip Elixirs is stocked at 89 licensed dispensaries across Nevada, Arizona, and California, 78 of them in Nevada, with the deepest coverage in Las Vegas, Henderson, Reno, North Las Vegas, and Sparks. Search by ZIP code or city below to find the closest one, or filter by product type if you are after a specific format.
Market Insights Snapshot
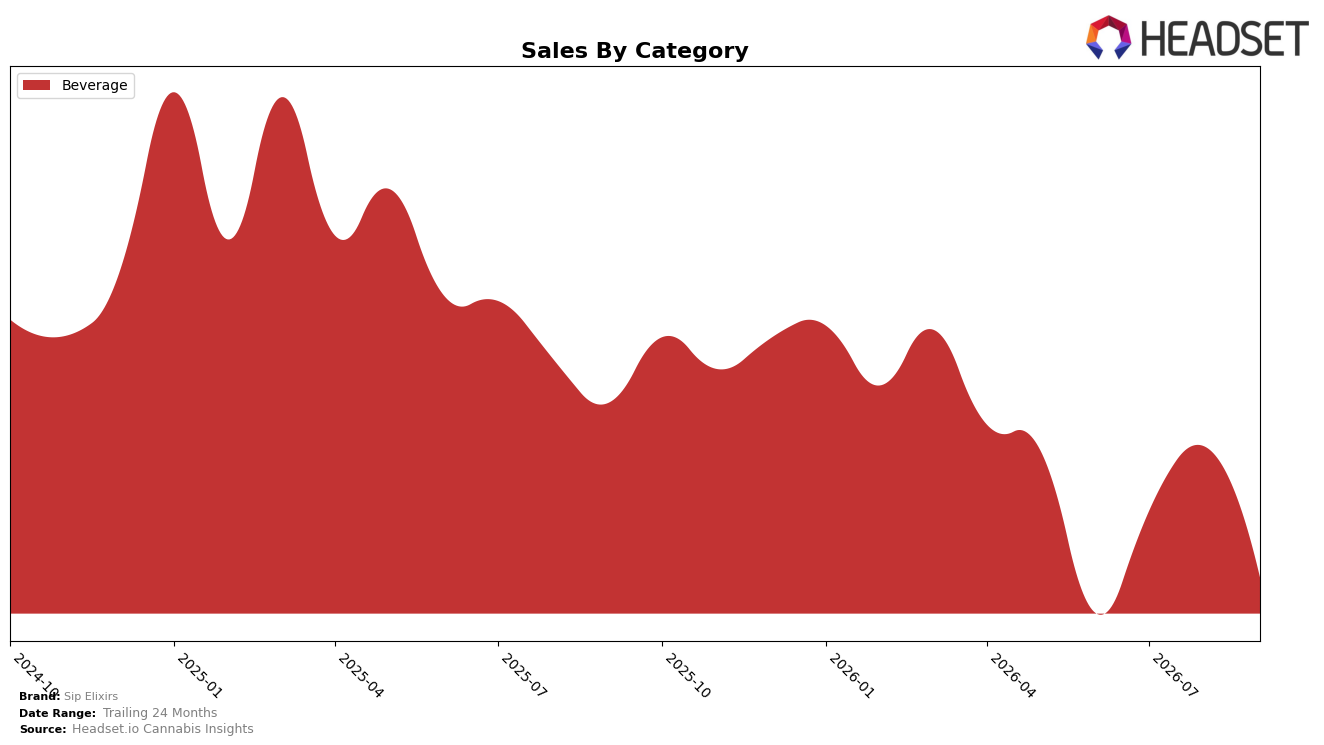
Sip Elixirs operated as a single-category brand in Beverage with a 100.0% mix in September 2026, posting a -16.9% year-over-year sales change alongside a -13.2% month-over-month decline, while average price rose 2.4% YoY to $8.02. Despite the category concentration, the brand held a rank of 1 in Beverage within Nevada, indicating that the -16.9% YoY contraction and the -13.2% MoM dip are occurring alongside local rank leadership rather than share loss to multi-category expansion. The pattern implies that September 2026 pressure is demand- and pricing-elasticity driven within Beverage rather than a portfolio allocation issue, and that maintaining a 100.0% category share of mix may constrain recovery if Beverage demand remains negative.
With Beverage at 100.0% of sales and a 2.4% YoY price increase paired with a -16.9% YoY and -13.2% MoM volume signal, Sip Elixirs is trading rank for revenue efficiency in the near term. Being ranked 1 in Beverage in Nevada while average price rises 2.4% YoY suggests price-led positioning is intact locally, but the twin declines of -16.9% YoY and -13.2% MoM indicate elasticity or occasion compression outweighs any premium realized. The implication is that the current single-category posture needs mix or pack-size tactics within Beverage to stabilize unit trajectory, because keeping 100.0% exposure to a falling category magnifies downside risk even when rank is 1.
Competitive Landscape
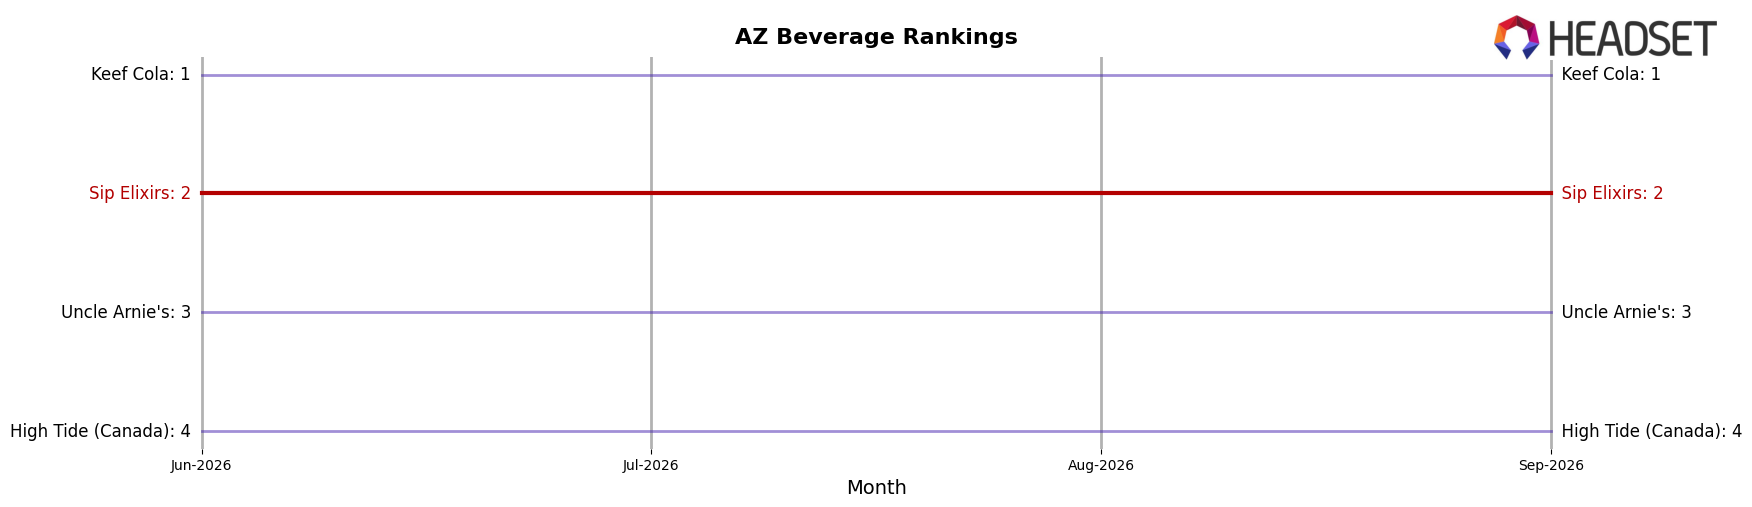
Sip Elixirs sits at #2 in AZ Beverage in September 2026, unchanged versus #2 a year earlier, after holding #2 three months running and peaking at #1 in October 2025; meanwhile, Keef Cola held #1 both this year and last year while posting a 4.38% year-over-year sales increase, and Uncle Arnie's climbed from #4 to #3 on 64.59% year-over-year growth as High Tide (Canada) slipped from #3 to #4 with an 8.65% decline, indicating Sip Elixirs’ flat rank at #2 amid an advancing #3 and a weakening #4 implies a stable hold on second place but rising pressure from below to defend against an overtake.
Notable Products
Sunset Punch Elixir (100mg THC, 1.75oz, 52ml) posted the steepest decline in September 2026 at -18.7% MoM while dropping behind Party - Hurricane Elixir (100mg THC, 1.75oz, 52ml), which held rank 1 despite a -14.6% MoM slide. Party - Electric Lemon Elixir (100mg THC, 1.75oz, 52ml) stayed at rank 2 with a -5.8% MoM change, and Sleep - Wild Berry Elixir (100mg THC, 1.75oz, 52ml) in rank 3 inched up +0.7% as Chill - Watermelon Elixir (100mg, 1.75oz, 52ml) at rank 4 gained +0.9% MoM. With all top 10 items in Beverage and three of the top four flat to slightly positive, the mix points to reliance on a narrow format where incremental gains in sleep and chill lines are being offset by sharper falls in party and novelty flavors, implying the brand is leaning into core beverage continuity over experimental rotation.
Top Selling Cannabis Brands






Data for this report comes from real-time sales reporting by participating cannabis retailers via their point-of-sale systems, which are linked up with Headset’s business intelligence software. Headset’s data is very reliable, as it comes digitally direct from our partner retailers. However, the potential does exist for misreporting in the instance of duplicates, incorrectly classified products, inaccurate entry of products into point-of-sale systems, or even simple human error at the point of purchase. Thus, there is a slight margin of error to consider. Brands listed on this page are ranked in the top twenty within the market and product category by total retail sales volume.

