.svg)

Aug-2026
Sales
Trend
6-Month
Product Count
SKUs
Avg Price
YoY Sales Change
YoY Price Change


Market Insights Snapshot
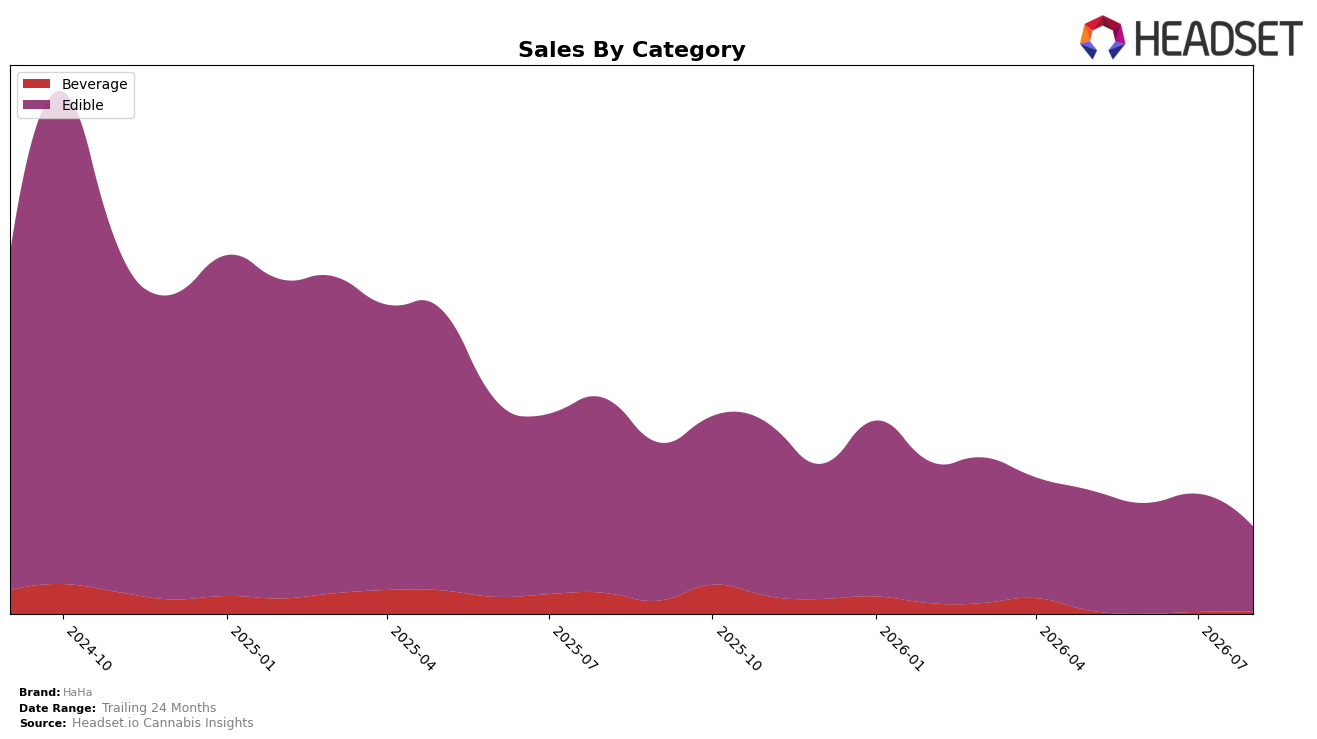
In August 2026, HaHa’s mix concentrated in Edible at 81.01% share while Beverage held 18.99% share, with Edible down 50.42% year over year and 23.39% month over month versus Beverage down 42.63% year over year but up 0.92% month over month; average prices moved in opposite directions at $15.73 in Edible and $9.65 in Beverage as the overall brand average fell 14.38% year over year. Within Nevada Edible, HaHa ranked 5, and brandwide sales declined 49.11% year over year and 70.16% over 24 months, implying that the category-heavy portfolio is amplifying downside in Edible while Beverage offers a modest offset.
The mix shift implies rising exposure to price-sensitive demand: the 14.38% brandwide price decrease alongside a 23.39% month-over-month contraction in Edible suggests elasticity that erodes revenue share even as Beverage posts a 0.92% month-over-month uptick and a smaller 42.63% year-over-year decline. Holding rank 5 in Nevada Edible while Edible contributes 81.01% of sales signals reliance on a weakening category, so sustaining position likely requires reallocating a portion of volume into Beverage where month-over-month momentum is positive and where lower average price points can capture traffic without further compressing the Edible base.
Competitive Landscape
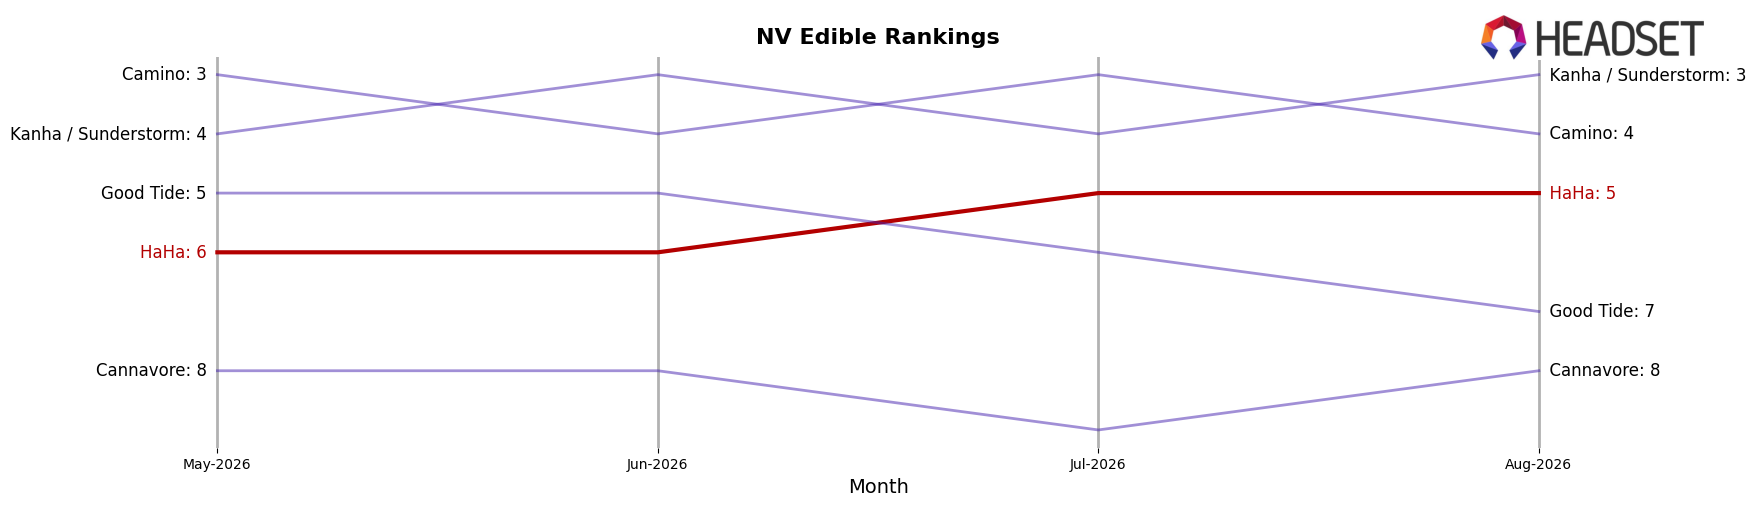
HaHa sits at rank #5 in NV Edible for August 2026, slipping 2 positions year over year from #3 while improving 1 spot from #6 three months ago; the brand’s peak at #2 in December 2024 contrasts with the current standing, indicating a multi-quarter descent interrupted by a recent quarter-on-quarter uptick. Competitive context points to Wyld holding #1 despite a -15.5% year-over-year sales change and Kanha / Sunderstorm advancing to #3 from #10 year over year with +201.9% growth, while Camino edged to #4 with +21.6% sales growth; relative to these moves, HaHa’s -2 rank change year over year versus a +1 improvement since May 2026 implies stabilization below the leaders and a need to counter faster-climbing rivals to avoid further share erosion.
Notable Products
Wicked Watermelon Gummies 10-Pack (100mg) posted the steepest decline in August 2026, falling 36.8% MoM to rank 6 while Pineapple Paradise Gummies 10-Pack (100mg) dropped 23.6% to rank 5, and CBG/THC 3:1 Mighty Mango Gummies 10-Pack (300mg CBG,100mg THC) slid 33.5% yet stayed at rank 1. Lucky Lemon Lime Soda (10mg, 12oz, 355ml) rose 45.6% MoM into rank 7, but Galaxy Grape Nano Soda (100mg THC, 355ml) fell 16.7% to rank 9, and eight of the top ten are Edible SKUs, indicating category weight despite month-on-month pullbacks. Strawberry Lemonade Gummies 10-Pack (100mg) eased 4.5% at rank 2 while CBD/THC 2:1 Blue Raspberry Gummies 10-Pack (200mg CBD,100mg THC) declined 16.0% at rank 3, and Beverage placements at ranks 7–10 contrast with double-digit Edible declines at ranks 1, 3, 5, and 6. The pattern implies HaHa is leaning on a concentrated Edible core for scale while tactical Beverage gains provide incremental resilience, suggesting near-term attention to stabilizing flagship gummies alongside nurturing the 10mg soda ladder.
Top Selling Cannabis Brands






Data for this report comes from real-time sales reporting by participating cannabis retailers via their point-of-sale systems, which are linked up with Headset’s business intelligence software. Headset’s data is very reliable, as it comes digitally direct from our partner retailers. However, the potential does exist for misreporting in the instance of duplicates, incorrectly classified products, inaccurate entry of products into point-of-sale systems, or even simple human error at the point of purchase. Thus, there is a slight margin of error to consider. Brands listed on this page are ranked in the top twenty within the market and product category by total retail sales volume.

