Market Insights Snapshot
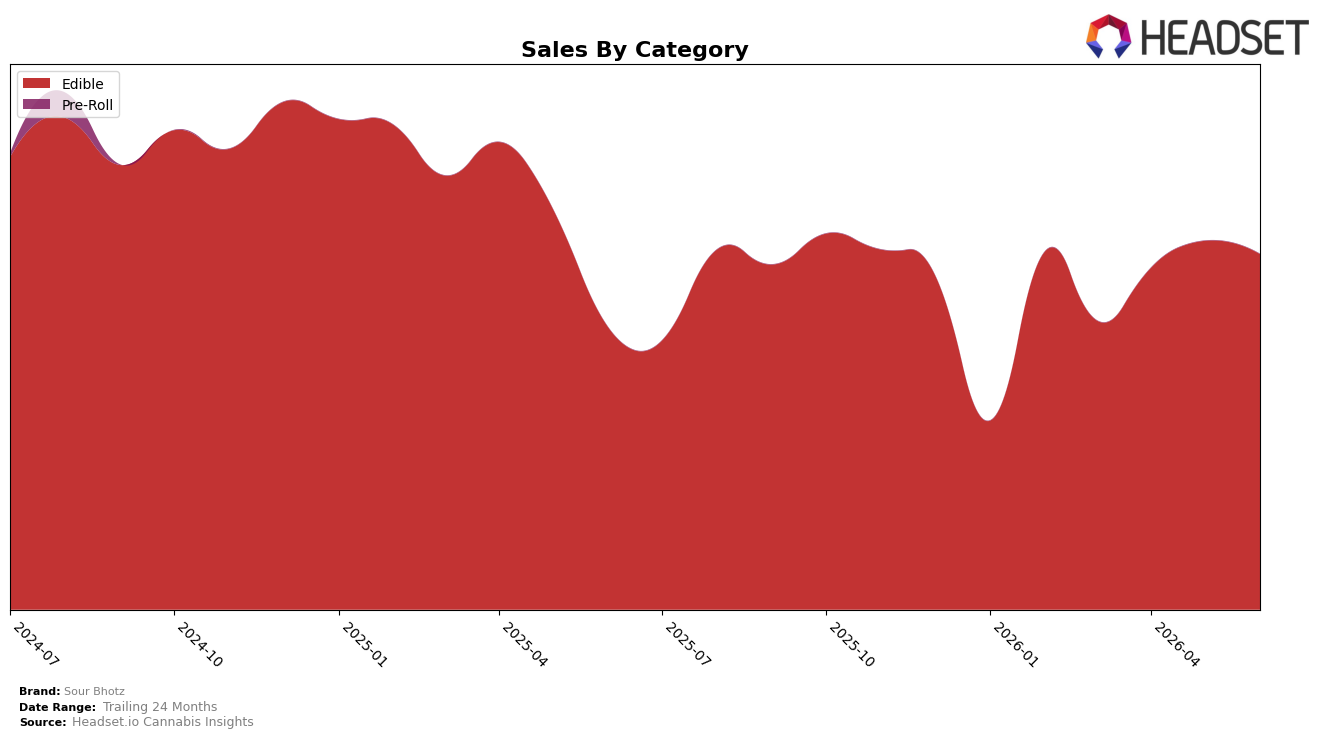
In June 2026, Sour Bhotz operated as a single-category brand with Edible at 100.0% of mix, pairing a 25.98% year-over-year rise with a -3.58% month-over-month dip; average price moved -0.81% YoY to $3.91. Within Oregon Edibles, the brand sat at rank 21 while total brand sales were up 25.98% YoY but down -3.58% MoM, implying that demand momentum is concentrated in a narrow lane and sensitive to short-cycle shifts. The pattern implies that a fully concentrated category stance can sustain double-digit YoY growth yet leaves short-term performance exposed when monthly category velocity softens.
The combination of a 100.0% Edible mix and a -0.81% price move YoY alongside rank 21 in Oregon suggests price-led accessibility is supporting volume but not elevating placement into the top 20, while the -3.58% MoM retreat signals limited insulation from intra-category noise. The thesis is that Sour Bhotz’s positioning is value-leaning within Edibles—capable of comping +25.98% YoY at a lower price point—yet requires either mix expansion or targeted SKU differentiation within Edibles to convert YoY momentum into rank gains and reduce MoM volatility.
Competitive Landscape
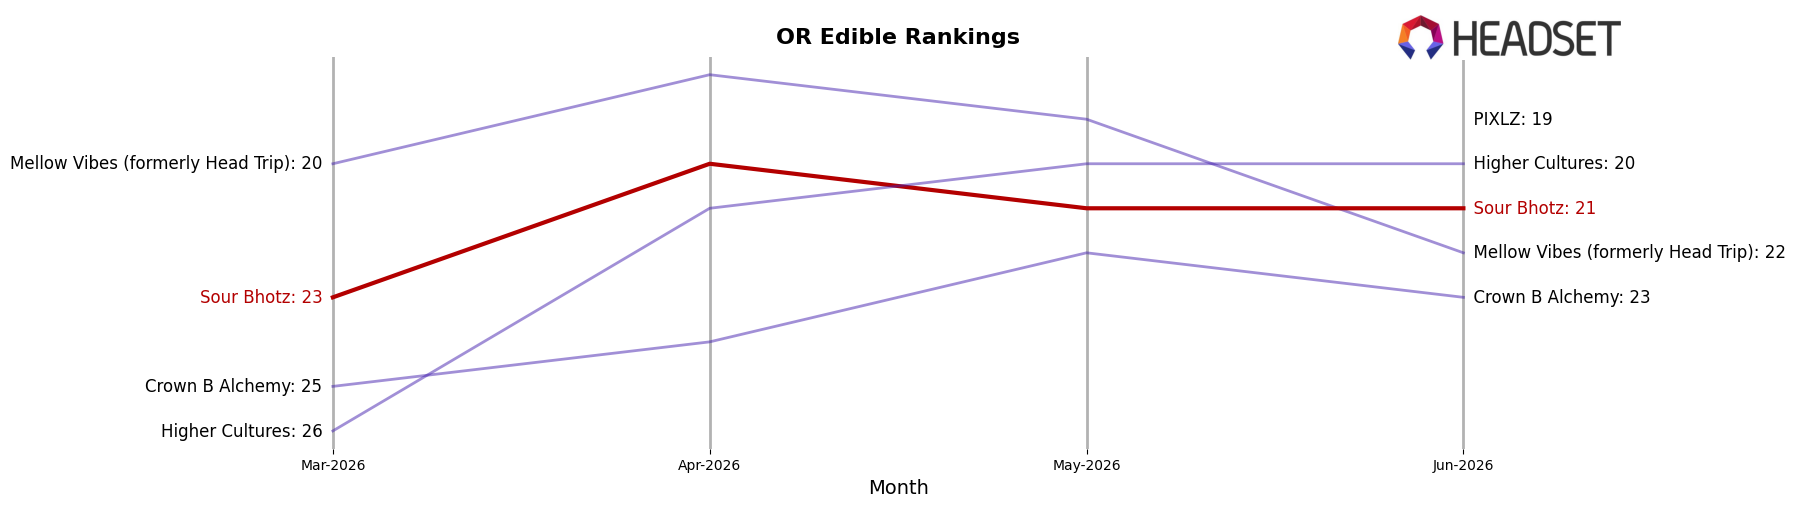
In June 2026, Sour Bhotz ranked #21 in OR Edible, improving 5 positions from #26 year over year, while sliding 2 spots from #23 since March 2026; the brand remains 4 places below its peak of #17 from January 2025, indicating partial recovery but not a return to best-ever placement. Against the competitive set, Wyld held #1 with a 45% year-over-year sales increase and Good Tide stayed #4 with an 89% year-over-year increase, outpacing Sour Bhotz’s rank momentum, whereas Mule Extracts remained #5 amid a 12% year-over-year sales decline, creating room for mid-pack shuffles; this mix of leaders accelerating and some incumbents contracting implies Sour Bhotz’s upward YoY rank change is driven more by displacement than share capture, so sustaining gains will require performance that closes the gap to the top 10.
Notable Products
Fruit Punch Gummy (100mg) posted the standout move in June 2026 with +1,098.8% MoM to rank 1, while Blue Razz Gummy (100mg) climbed +148.7% to rank 3, signaling a sharp pivot toward fruit-forward SKUs at the very top. Indica Cherry Cola Gummy (100mg) advanced +105.0% to rank 2, yet five SKUs from ranks 6–10 fell between -39.8% and -93.4%, including Pineapple Gummy (100mg) at -93.4% and Tangerine Gummy (100mg) at -75.6%, indicating volatility beneath the leaders. With four of the top five in the Edible gummy family posting +68.2% to +1,098.8% MoM and a $12,144 haul concentrated in the number-one SKU, the mix implies Sour Bhotz is consolidating demand into a few breakout gummies while pruning or repositioning lagging flavors.
Top Selling Cannabis Brands
Data for this report comes from real-time sales reporting by participating cannabis retailers via their point-of-sale systems, which are linked up with Headset’s business intelligence software. Headset’s data is very reliable, as it comes digitally direct from our partner retailers. However, the potential does exist for misreporting in the instance of duplicates, incorrectly classified products, inaccurate entry of products into point-of-sale systems, or even simple human error at the point of purchase. Thus, there is a slight margin of error to consider. Brands listed on this page are ranked in the top twenty within the market and product category by total retail sales volume.

