.svg)

Sep-2026
Sales
Trend
6-Month
Product Count
SKUs
Avg Price
YoY Sales Change
YoY Price Change


Market Insights Snapshot
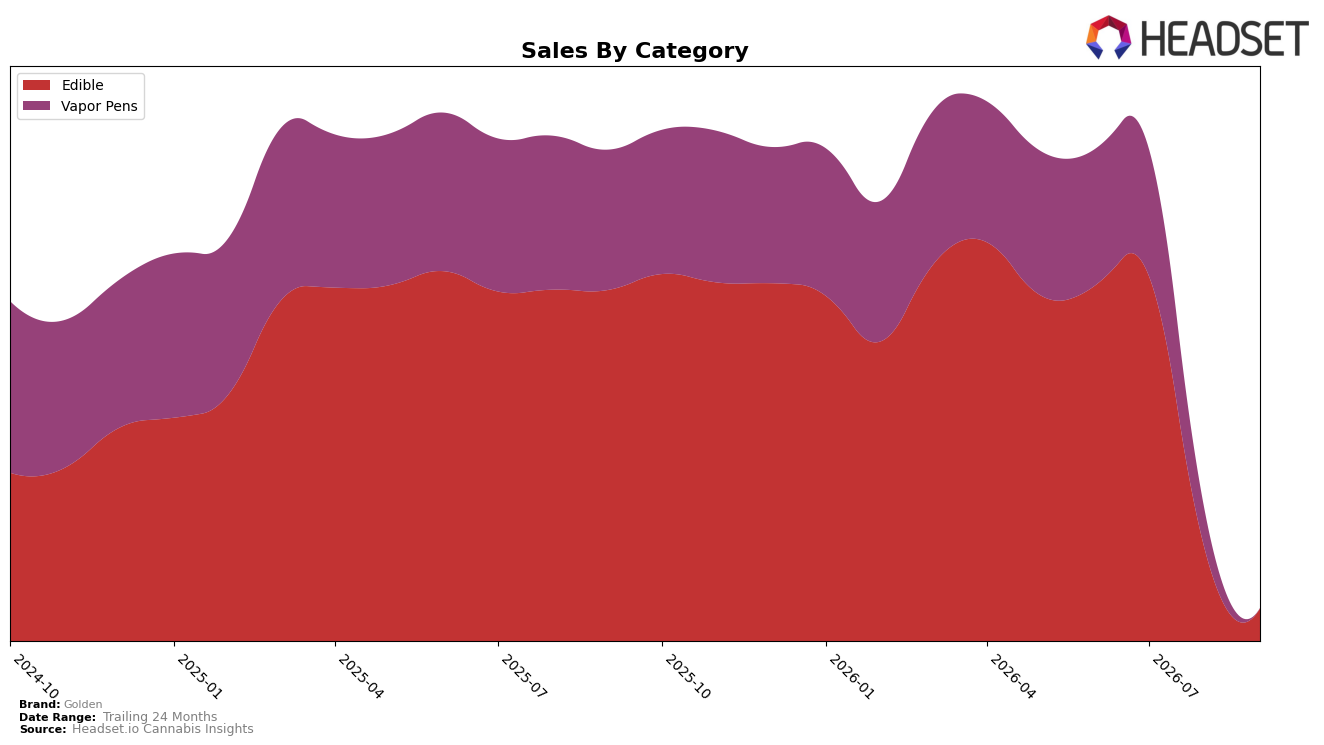
In September 2026, Golden’s mix concentrated entirely in Edible, with category share at 100.0% while sales in that category fell 90.7% year over year and 64.6% month over month; simultaneously, brand-level sales declined 93.4% YoY and average price was up 4.7% YoY. The absence of any ranked position in Oregon Edible and a 64.6% MoM contraction indicate the portfolio has narrowed to a single format at the very moment volume is retrenching, implying product breadth has collapsed faster than demand could consolidate.
The shift to a 100.0% Edible mix alongside a 4.7% YoY price increase and a 90.7% YoY category decline suggests Golden is leaning on price over mix diversification, while overall brand sales dropped 93.4% YoY and Edible volume slid 64.6% MoM. With no current rank in Oregon Edible and a 24-month decline of 90.5%, the pattern implies Golden’s positioning is now niche and price-sensitive within a single category, concentrating risk in Edible where elasticity and shelf visibility are eroding faster than the brand can offset through pricing.
Competitive Landscape
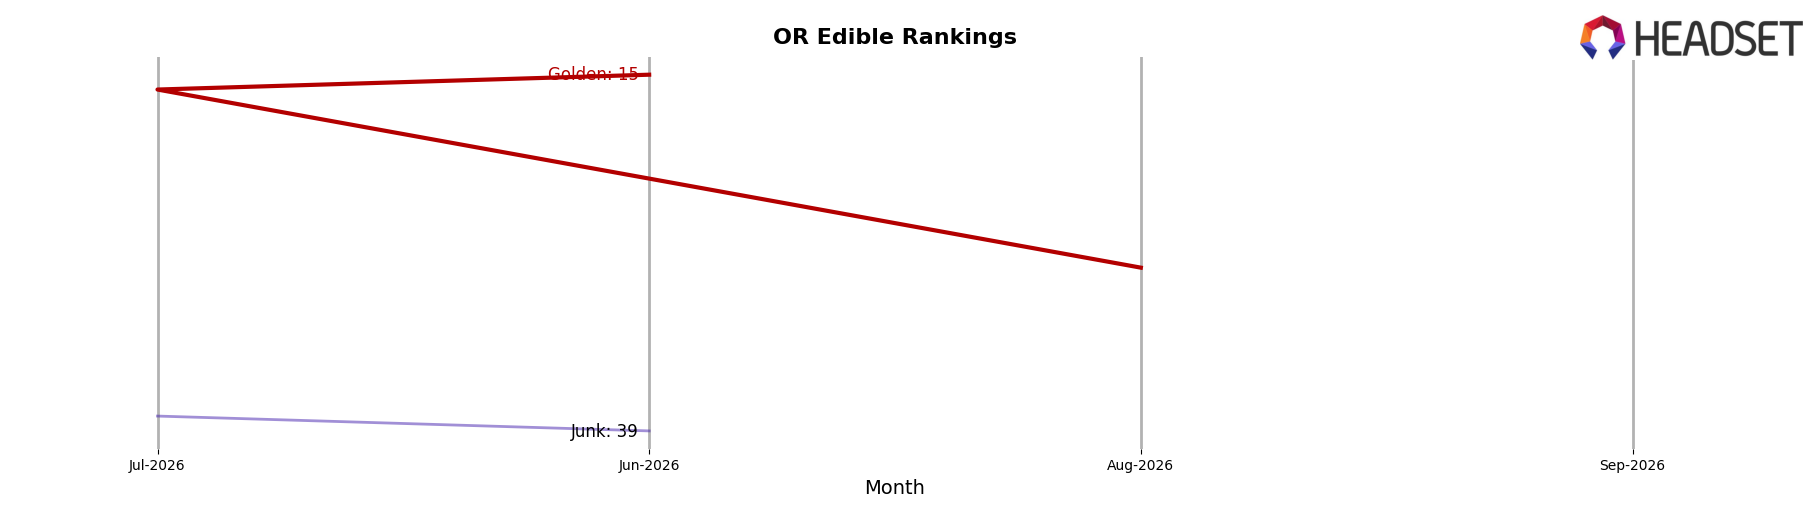
Golden sits at rank #39 in OR Edible for September 2026, down 23 positions year over year from #16, while falling 24 spots since June 2026 when it peaked at #15; in contrast, Wyld held #1 with a 4.3% YoY sales increase and Gron / Grön stayed #2 with a 5.0% YoY sales decline, indicating category leadership remained concentrated as Golden lost share. The three-month slide from #15 in June 2026 to #39 in September 2026 spans a 24-rank drop, while Golden also trails Drops at #3 despite Drops posting a 0.5% YoY sales decline; meanwhile, Mule Extracts advanced to #5 alongside a 5.9% YoY sales gain, showing up-market competitors are consolidating rank even where some face negative growth. This rank trajectory implies Golden’s mid-year peak did not convert to sustained placement, and the gap versus top-5 incumbents is widening as Golden’s visibility and distribution velocity likely eroded despite mixed growth among leaders.
Notable Products
Black Cherry Fruit Chew 10 Pack (100mg) led September 2026 with a rank of 1 but fell 6.1% month over month, while CBD/THC 1:1 Acai Berry Fruit Chews Blast 10-Pack (50mg CBD, 50mg THC) entered at rank 2 with no prior baseline and a single-month sales figure of $969. Two top-2 placements in Edibles alongside a sub-10% decline at the flagship SKU signal a concentration strategy where category leadership is being maintained through breadth within Fruit Chews rather than across categories.
Top Selling Cannabis Brands






Data for this report comes from real-time sales reporting by participating cannabis retailers via their point-of-sale systems, which are linked up with Headset’s business intelligence software. Headset’s data is very reliable, as it comes digitally direct from our partner retailers. However, the potential does exist for misreporting in the instance of duplicates, incorrectly classified products, inaccurate entry of products into point-of-sale systems, or even simple human error at the point of purchase. Thus, there is a slight margin of error to consider. Brands listed on this page are ranked in the top twenty within the market and product category by total retail sales volume.

