Market Insights Snapshot
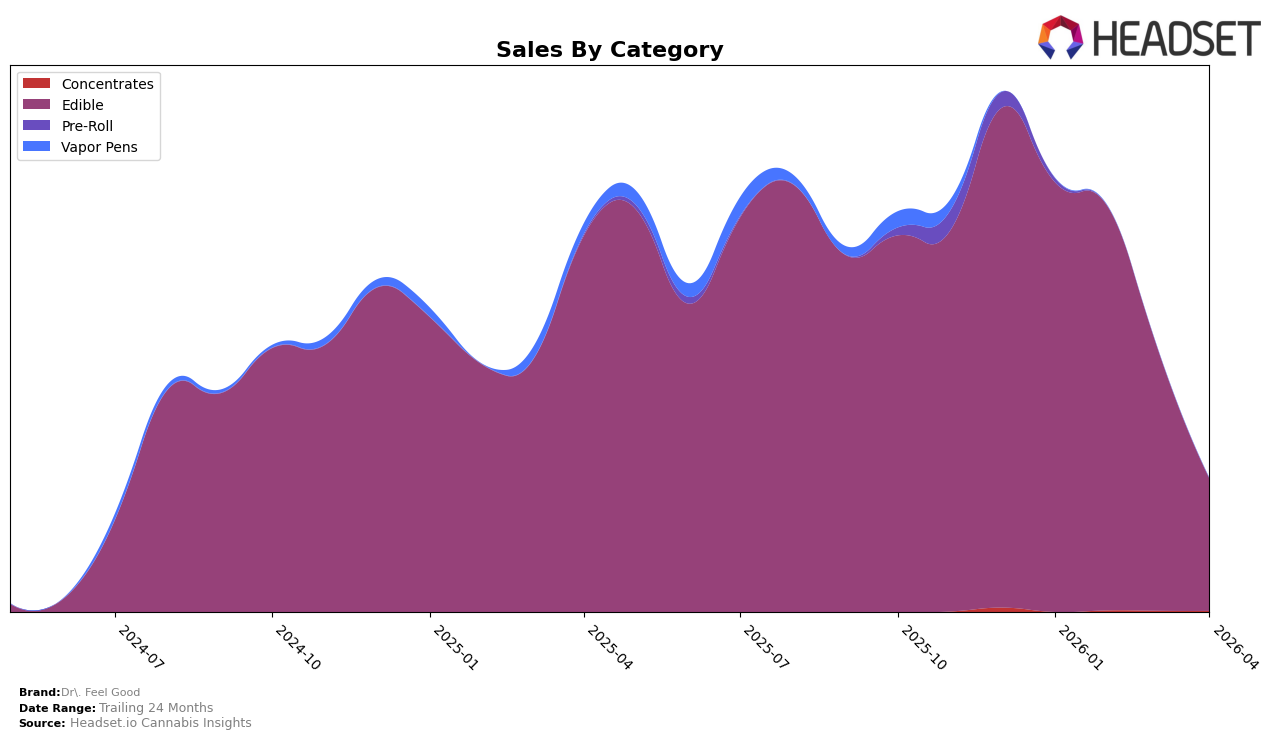
In the state of Oregon, Dr. Feel Good has experienced a noticeable decline in the Edible category rankings over the first four months of 2026. Starting at the 13th position in January, the brand has gradually slipped to the 21st position by April. This downward trajectory is accompanied by a consistent decrease in sales, with April's sales figures nearly a third of what they were in January. Such a decline in both ranking and sales could indicate increased competition in the market or shifts in consumer preferences away from Dr. Feel Good's offerings in this category.
The absence of Dr. Feel Good from the top 30 rankings in other states and categories suggests challenges in expanding their market presence beyond Oregon or in diversifying their product lines effectively. This lack of visibility in other regions and categories could be indicative of strategic choices or market barriers that the brand has yet to overcome. While the Edible category in Oregon remains a focal point, the brand's performance in this single market might not be enough to sustain long-term growth without addressing its limited reach and declining trend.
Competitive Landscape
In the competitive landscape of the Oregon edible cannabis market, Dr. Feel Good has experienced notable shifts in its ranking and sales performance from January to April 2026. Initially ranked 13th in January, Dr. Feel Good saw a decline to 21st by April, indicating increased competition and potential challenges in maintaining its market position. This downward trend in rank is mirrored by a significant drop in sales, particularly evident when comparing the robust figures from January to the more modest numbers in April. Competitors such as Bitz & Botz have also experienced fluctuations, dropping from 15th to 19th, yet they maintain a relatively stronger sales performance compared to Dr. Feel Good. Meanwhile, Pacific Wave has shown resilience, climbing into the top 20 by April, and Fire Dept. Cannabis has consistently improved its rank, suggesting a competitive edge in capturing market share. These dynamics highlight the importance for Dr. Feel Good to reassess its strategies to regain its foothold in the market.

Notable Products
In April 2026, the top-performing product for Dr. Feel Good was the Peach Mango Rosin Gummy (100mg), which regained its number one rank after dropping to third place in March. Notably, its sales reached 1761 units, showing a recovery from the previous month. The Ginger Pear Distillate Gummy (100mg) maintained a steady second position, despite a decrease in sales compared to March. The Blueberry Lemonade Distillate Gummy (100mg) fell to third place, experiencing a significant drop in sales. New to the list, Blueberry Lemonade Distillate Gummies 10-Pack (100mg) entered the rankings in fourth place, indicating growing interest in multi-pack options.
Top Selling Cannabis Brands
Data for this report comes from real-time sales reporting by participating cannabis retailers via their point-of-sale systems, which are linked up with Headset’s business intelligence software. Headset’s data is very reliable, as it comes digitally direct from our partner retailers. However, the potential does exist for misreporting in the instance of duplicates, incorrectly classified products, inaccurate entry of products into point-of-sale systems, or even simple human error at the point of purchase. Thus, there is a slight margin of error to consider. Brands listed on this page are ranked in the top twenty within the market and product category by total retail sales volume.

