.svg)

Sep-2026
Sales
Trend
6-Month
Product Count
SKUs
Avg Price
YoY Sales Change
YoY Price Change


Where to Buy
Spherex is stocked at 178 licensed dispensaries across Colorado, with the deepest coverage in Denver, Colorado Springs, Aurora, Longmont, and Boulder. Search by ZIP code or city below to find the closest one, or filter by product type if you are after a specific format.
Market Insights Snapshot
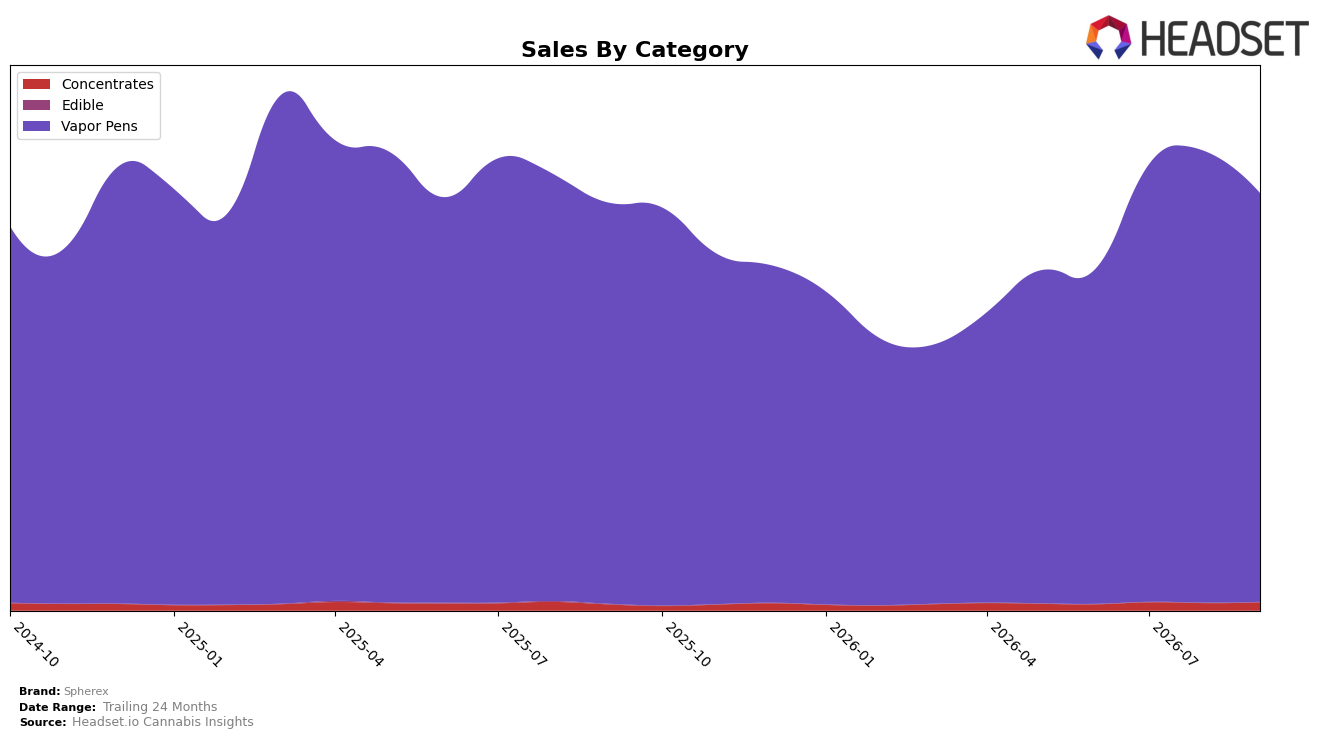
Spherex remained overwhelmingly concentrated in Vapor Pens at 98.09% share in September 2026, while Concentrates accounted for 1.91% of sales, indicating a narrow category mix despite mixed growth signals. Vapor Pens posted 1.92% year-over-year growth but declined 9.45% month-over-month, whereas Concentrates grew 35.04% year-over-year and 10.78% month-over-month; average price for the brand fell 1.25% year-over-year to $17.57. Holding rank 1 in Vapor Pens in Colorado alongside a 2.36% brand-level year-over-year sales increase implies that short-term softness is concentrated in the core format, while incremental growth is being picked up by the small but faster-moving Concentrates segment.
The divergence—Vapor Pens down 9.45% month-over-month while Concentrates rose 10.78% month-over-month, with 35.04% year-over-year Concentrates growth versus 1.92% for Vapor Pens—signals a nascent portfolio hedge that could reduce dependence on a single category. Given 98.09% of sales still sit in Vapor Pens and the brand holds rank 1 in Colorado, the near-term positioning hinges on stabilizing monthly Vapor Pen demand while selectively scaling Concentrates where elasticity from a 1.25% year-over-year price decline can be leveraged; the pattern implies maintaining leadership while reallocating marginal effort to the faster-growing but small Concentrates niche to smooth volatility.
Competitive Landscape
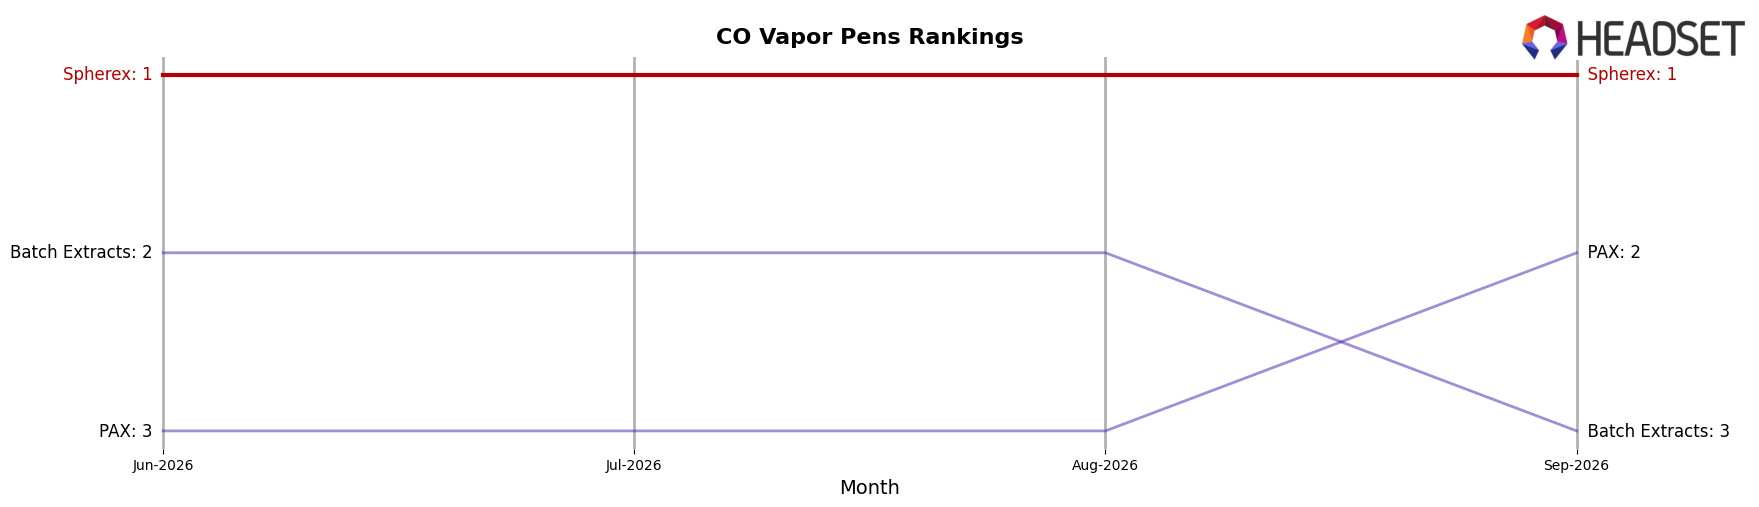
Spherex is ranked #1 in Colorado Vapor Pens in September 2026, unchanged from #1 a year earlier, while holding #1 for the past three months and peaking at #1 in September 2026; in contrast, PAX moved from #3 to #2 with a 34.7% year-over-year sales increase and Jetty Extracts climbed from #15 to #4 on 150.9% growth, indicating that rising challengers are compressing the gap even as Spherex maintains the top rank, which implies sustained leadership depends on defending against faster rank mobility among ascendant competitors.
Notable Products
X Vapes - Melon Baller Distillate Cartridge (1g) posted the steepest movement in September 2026 with a -29.6% MoM drop and sat at rank 8, while X Vapes - Strawguava Distillate Cartridge (1g) similarly fell -27.8% to rank 7; in contrast, X Vapes - Blueberry Cake Distillate Cartridge (1g) rose +30.3% to rank 1 with about $207,000 in sales. Eight of the top ten are Vapor Pens from the X Vapes line, and within that cluster the top three held ranks 1–3 with MoM shifts of +30.3%, +1.1%, and +12.2%, whereas ranks 7–10 contracted between -20.7% and -29.6%. The split between double-digit gains at the top and double-digit declines at the lower end implies SKU pruning potential and a tilt toward fewer hero flavors driving the portfolio’s September 2026 momentum.
Top Selling Cannabis Brands






Data for this report comes from real-time sales reporting by participating cannabis retailers via their point-of-sale systems, which are linked up with Headset’s business intelligence software. Headset’s data is very reliable, as it comes digitally direct from our partner retailers. However, the potential does exist for misreporting in the instance of duplicates, incorrectly classified products, inaccurate entry of products into point-of-sale systems, or even simple human error at the point of purchase. Thus, there is a slight margin of error to consider. Brands listed on this page are ranked in the top twenty within the market and product category by total retail sales volume.

