Jun-2026
Sales
Trend
6-Month
Product Count
SKUs
Avg Price
YoY Sales Change
YoY Price Change
Market Insights Snapshot
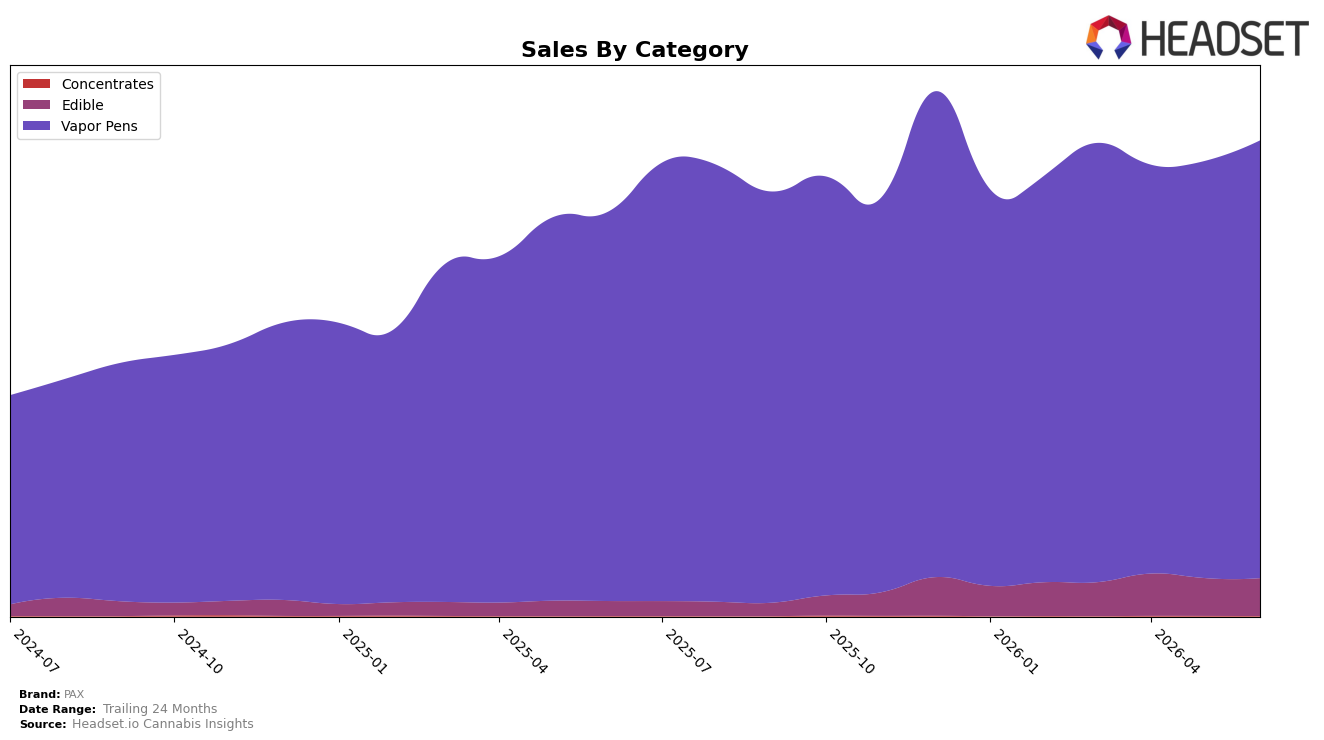
PAX’s mix in June 2026 is overwhelmingly Vapor Pens at 92.07% share with year-over-year growth of 12.43% and month-over-month growth of 4.96%, while Edible holds 7.89% share with 156.61% year-over-year growth but only 0.06% month-over-month growth; Concentrates is negligible at 0.05% share with 3.81% year-over-year growth and a 36.42% month-over-month decline. Average price contracted 6.55% year over year to $40.90 even as total brand sales rose 17.63% year over year, and within the core, Vapor Pens’ average price sat higher at $45.17 versus Edible at $19.45; in its core category positioning, the brand sat at rank 2 in Vapor Pens in Colorado. The pattern implies volume-led gains concentrated in Vapor Pens with a secondary Edible expansion that is not yet accelerating month to month, suggesting the brand is prioritizing breadth within its flagship form factor while testing Edible without near-term share reallocation.
Given 92.07% mix in Vapor Pens alongside rank 2 in Colorado, the brand remains a category specialist whose growth is tied to defending and compounding Vapor Pens velocity rather than diversifying; the 4.96% month-over-month uptick there versus Edible’s 0.06% points to near-term reinforcement of this specialization. The 6.55% year-over-year price decrease paired with 17.63% sales growth implies a pricing-to-volume trade that supports share within Vapor Pens while keeping Edible constrained to a 7.89% share despite 156.61% year-over-year growth, meaning positioning skews toward high-frequency hardware-adjacent consumers rather than shifting basket missions toward lower-priced ingestibles.
Competitive Landscape
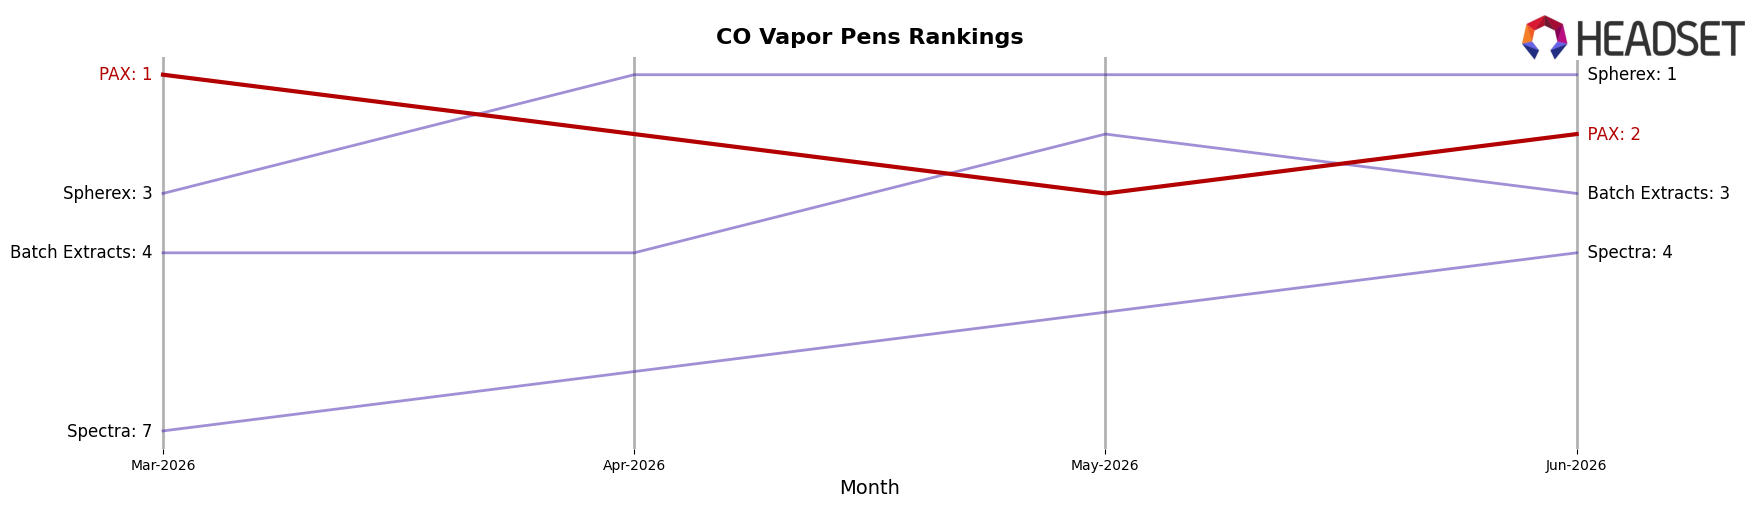
PAX sits at rank #2 in Colorado Vapor Pens as of June 2026, improving 1 position year over year from #3 while slipping 1 place from March 2026 when it peaked at #1; by comparison, Spherex holds #1 after moving down 1 rank year over year from #2 with a 9.6% YoY sales decline, and Batch Extracts is #3 after rising 1 spot from #4 with a 59.3% YoY sales increase. The competitive spread narrows further as Spectra climbed from #11 to #4 on 113.1% YoY growth while Bonanza Cannabis Company fell from #1 to #5 on a 67.4% YoY decline, indicating that PAX’s shift from #1 in March 2026 to #2 in June 2026 amidst upward pressure from faster-rising midpack rivals points to a contested top tier where maintaining share requires offsetting competitor momentum rather than only defending rank.
Notable Products
Trip- Grapefruit Haze Live Rosin Diamonds Disposable (1g) posted the sharpest move in June 2026 with +31.2% MoM to rank 4, while Trip - Maui Wowie Live Resin Diamonds Disposable Pax Era Pod (1g) climbed +29.0% MoM to rank 2, indicating momentum is concentrated in a few fast-advancing SKUs rather than broad-based growth. Trip - Blue Dream Fresh Pressed Live Rosin Diamonds Disposable Pax Era Pod (1g) held rank 1 with +11.5% MoM and an estimated $521,039, while Blue Dream Fresh Press Live Rosin Diamonds Pax Era Pod (1g) at rank 8 rose +8.0% MoM, and four of the top ten are Vapor Pens dominating ranks 1 through 5 with Edibles clustered at ranks 6–10. With Vapor Pens capturing the top-five ranks and Edibles like Wild Strawberry Live Rosin Gummies 10-Pack (100mg) growing +21.5% MoM at rank 6 but not breaking into the top tier, the mix implies PAX is tilting assortment and demand toward higher-velocity pen formats while using edibles as a secondary, steady-growth pillar.
Top Selling Cannabis Brands
Data for this report comes from real-time sales reporting by participating cannabis retailers via their point-of-sale systems, which are linked up with Headset’s business intelligence software. Headset’s data is very reliable, as it comes digitally direct from our partner retailers. However, the potential does exist for misreporting in the instance of duplicates, incorrectly classified products, inaccurate entry of products into point-of-sale systems, or even simple human error at the point of purchase. Thus, there is a slight margin of error to consider. Brands listed on this page are ranked in the top twenty within the market and product category by total retail sales volume.

