Jun-2026
Sales
Trend
6-Month
Product Count
SKUs
Avg Price
YoY Sales Change
YoY Price Change
Market Insights Snapshot
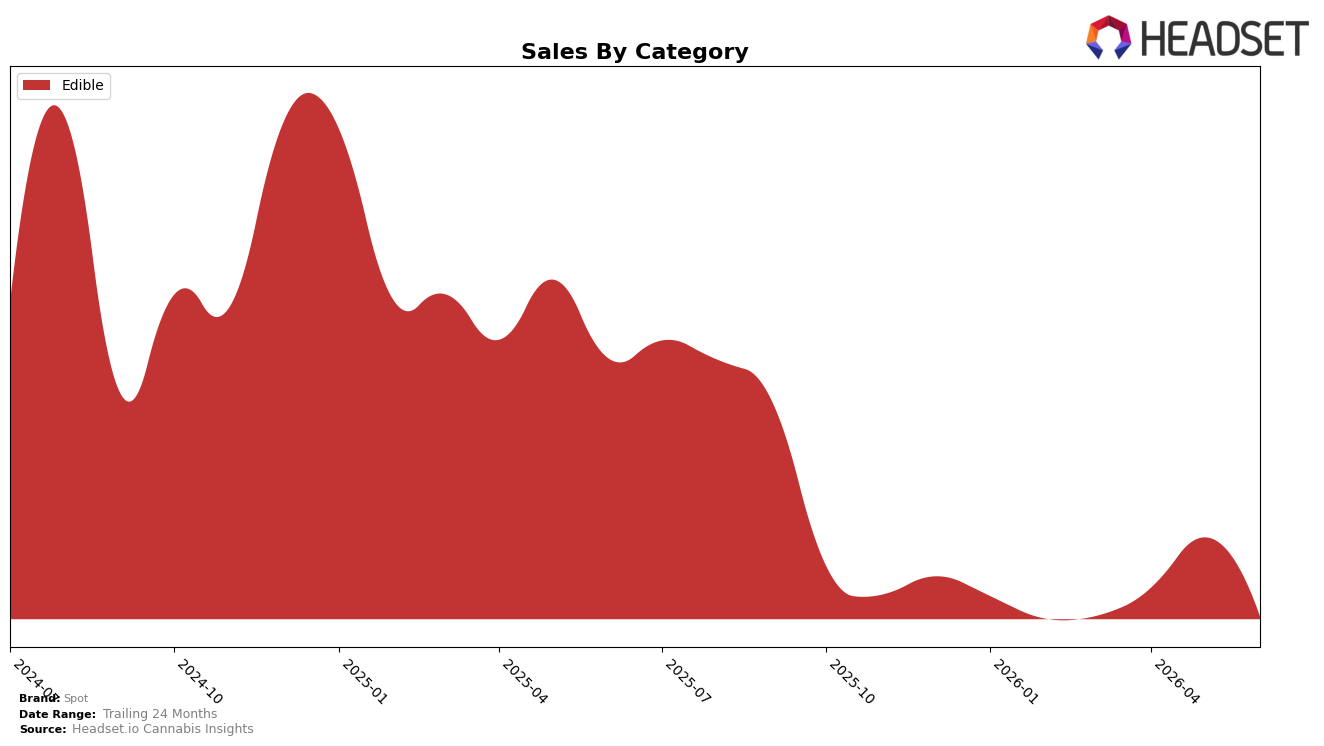
In June 2026, Spot was fully concentrated in Edible with a 100.0% mix, while category sales fell 51.4% year over year and 24.5% month over month; the average price in Edible edged up 0.2% YoY to $3.70 but carried no MoM offset against volume pressure. Holding a single-category focus alongside a rank of 26 in Edible in Ontario suggests concentration risk amplified the 51.4% YoY contraction and left little buffer against the 24.5% MoM dip.
The shift toward a 100.0% Edible mix, combined with a 0.2% YoY price uptick and a 26th rank in Ontario, implies the brand is trading on low price points rather than mix breadth, which constrains share recovery when category velocity softens by 24.5% MoM. With sales down 51.4% YoY and 66.7% over 24 months, the positioning leans defensive on price but exposed on assortment breadth, indicating that even small pricing moves can outsize volume effects in Edible and that diversification would be required to stabilize rank around 26 under similar month-to-month swings.
Competitive Landscape
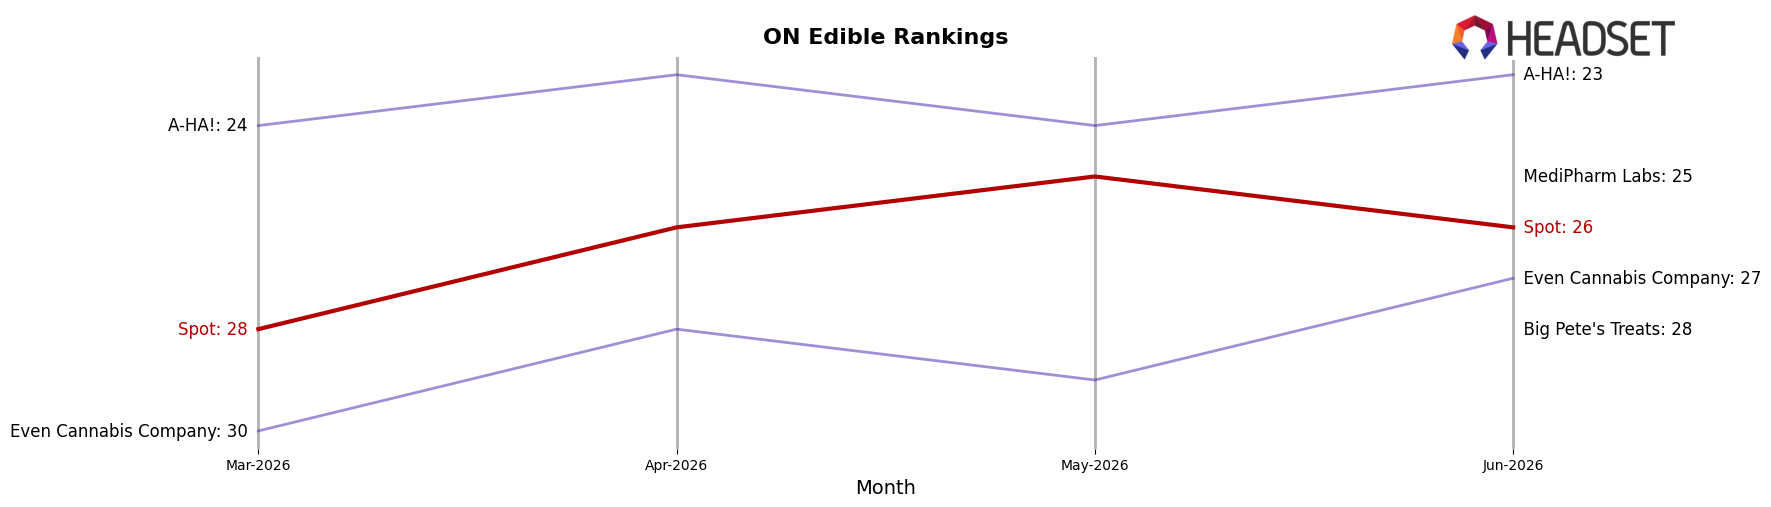
Spot sits at rank #26 in ON Edible for June 2026, improving 1 position year over year from #27 and 2 positions since March 2026 from #28, yet it remains 2 places below its peak of #24 from February 2025; meanwhile, Wyld climbed from #4 to #3 with a 21.9% year-over-year sales lift and Olli advanced from #7 to #4 alongside a 120.7% year-over-year sales increase, indicating that mid-tier movement is occurring faster among competitors than Spot’s incremental rank gains, which implies a need for acceleration to avoid being outpaced despite modest upward trajectory.
Notable Products
CBG:THC 4:1 Gooseberry Soft Chews 2-Pack (40mg CBG, 10mg THC) fell 26.5% month over month to $8,158 and dropped to rank 1 from a prior higher baseline, while Sativa Sour Citrus Splash Soft Chews (10mg) declined 19.7% and sat at rank 2. Two of the top ten are Edible SKUs, concentrating share in a single category even as both leaders posted double-digit declines. The pattern implies demand is consolidating around a narrow Edible core that is losing momentum, signaling a need to diversify formats or refresh formulations to stabilize mix.
Top Selling Cannabis Brands
Data for this report comes from real-time sales reporting by participating cannabis retailers via their point-of-sale systems, which are linked up with Headset’s business intelligence software. Headset’s data is very reliable, as it comes digitally direct from our partner retailers. However, the potential does exist for misreporting in the instance of duplicates, incorrectly classified products, inaccurate entry of products into point-of-sale systems, or even simple human error at the point of purchase. Thus, there is a slight margin of error to consider. Brands listed on this page are ranked in the top twenty within the market and product category by total retail sales volume.

