.svg)


Market Insights Snapshot
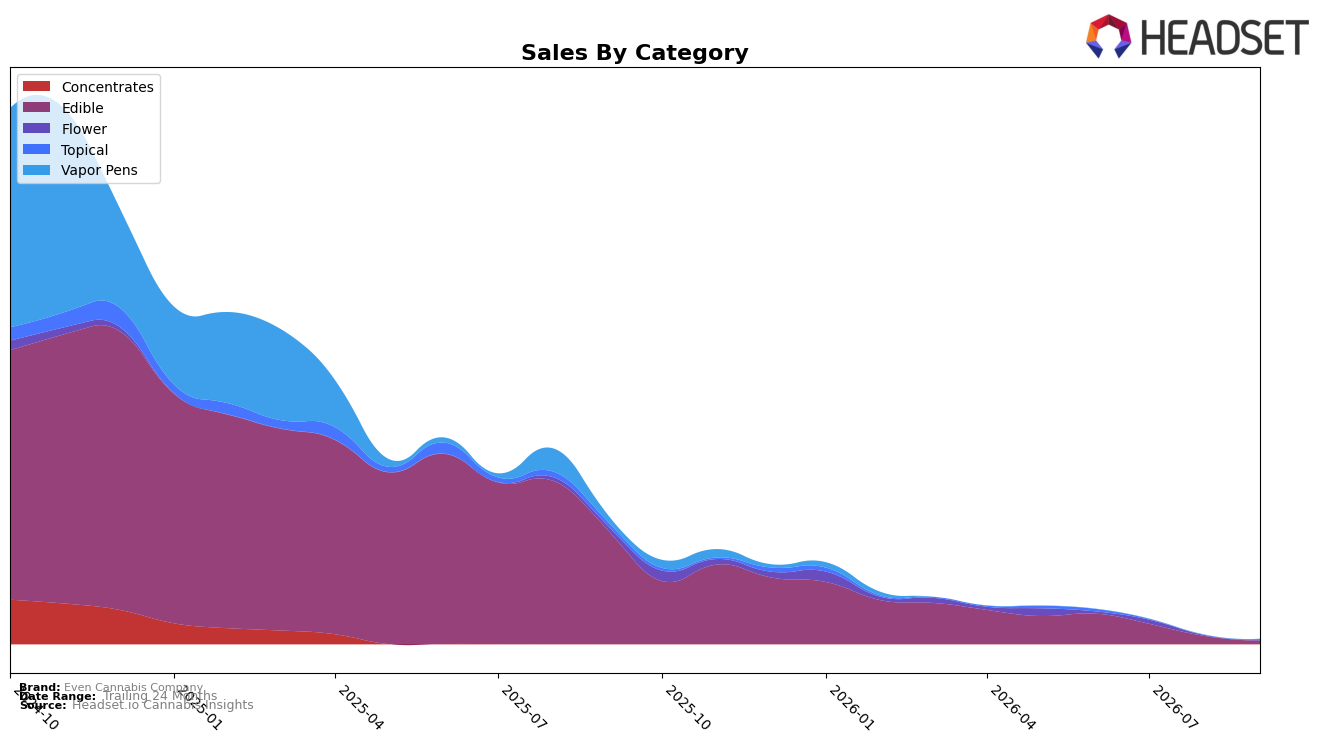
Even Cannabis Company concentrated 73.38% of September 2026 sales in Edible, with Flower at 26.62%, indicating a two-category footprint where Edible volume contracted sharply year over year by 97.19% while Flower declined 72.08% YoY. Month over month, Edible fell 59.63% as Flower rose 89.09%, and the brand’s overall average price dipped 0.87% YoY alongside an Edible average price of $11.66. With rank in Edible unspecified in Ontario, the pattern points to a rapid rebalancing toward Flower on a monthly basis despite a dominant but shrinking Edible base.
The 59.63% MoM pullback in Edible alongside an 89.09% MoM surge in Flower implies a tactical pivot toward higher-ticket units (Flower avg price $30.60 vs. Edible $11.66) as the brand navigates a 96.61% YoY sales decline and a 98.87% two-year contraction. Because Edible still holds a 73.38% share while posting deeper YoY erosion than Flower (97.19% vs. 72.08%), the mix suggests overexposure to a rapidly shrinking anchor and near-term positioning upside if the brand accelerates SKU or distribution shift into Flower where monthly momentum is present.
Competitive Landscape
Even Cannabis Company sits at rank #43 in ON Edible for September 2026 after a year-over-year slide of 16 positions from #27, contrasting with a three-month drop of 16 ranks from #27 to #43 and a wider gap from its peak at #24 in August 2025; meanwhile, Spinach held #1 with a 7.3% YoY sales lift and Wyld slipped from #4 to #5 despite 17.8% YoY growth, indicating Even Cannabis Company’s decline is tied more to relative share loss than category demand trends. The combination of a -16 YoY rank change and a -16 rank move since June 2026, against competitors like Olli climbing from #5 to #3 on 47.0% YoY growth and No Future rising from #6 to #4 on 45.6% YoY growth, implies Even Cannabis Company’s trajectory reflects competitive displacement rather than a cyclical dip, signaling the need to regain shelf velocity to prevent further share erosion.

Notable Products
CBD Blue Raspberry Lemonade Fast Acting Gummies 50-Pack (1500mg CBD) posted the steepest September 2026 drop at -74.3% MoM while falling to rank 4, and CBD Mango Lemonade Gummies 30-Pack (750mg CBD) also declined -57.9% MoM at rank 2. Against those pullbacks, Gary Satan (3.5g) rose 89.5% MoM to rank 3, signaling a pivot toward Flower as Edibles soften. With two of the top four SKUs in Edible categories yet both contracting double-digits, the outlier Flower gain suggests demand is consolidating away from CBD-heavy gummies toward inhalable formats. The pattern implies Even Cannabis Company is likely to lean into Flower expansion while rationalizing CBD Edible depth to protect mix and velocity.
Top Selling Cannabis Brands






Data for this report comes from real-time sales reporting by participating cannabis retailers via their point-of-sale systems, which are linked up with Headset’s business intelligence software. Headset’s data is very reliable, as it comes digitally direct from our partner retailers. However, the potential does exist for misreporting in the instance of duplicates, incorrectly classified products, inaccurate entry of products into point-of-sale systems, or even simple human error at the point of purchase. Thus, there is a slight margin of error to consider. Brands listed on this page are ranked in the top twenty within the market and product category by total retail sales volume.

