Jun-2026
Sales
Trend
6-Month
Product Count
SKUs
Avg Price
YoY Sales Change
YoY Price Change
Market Insights Snapshot
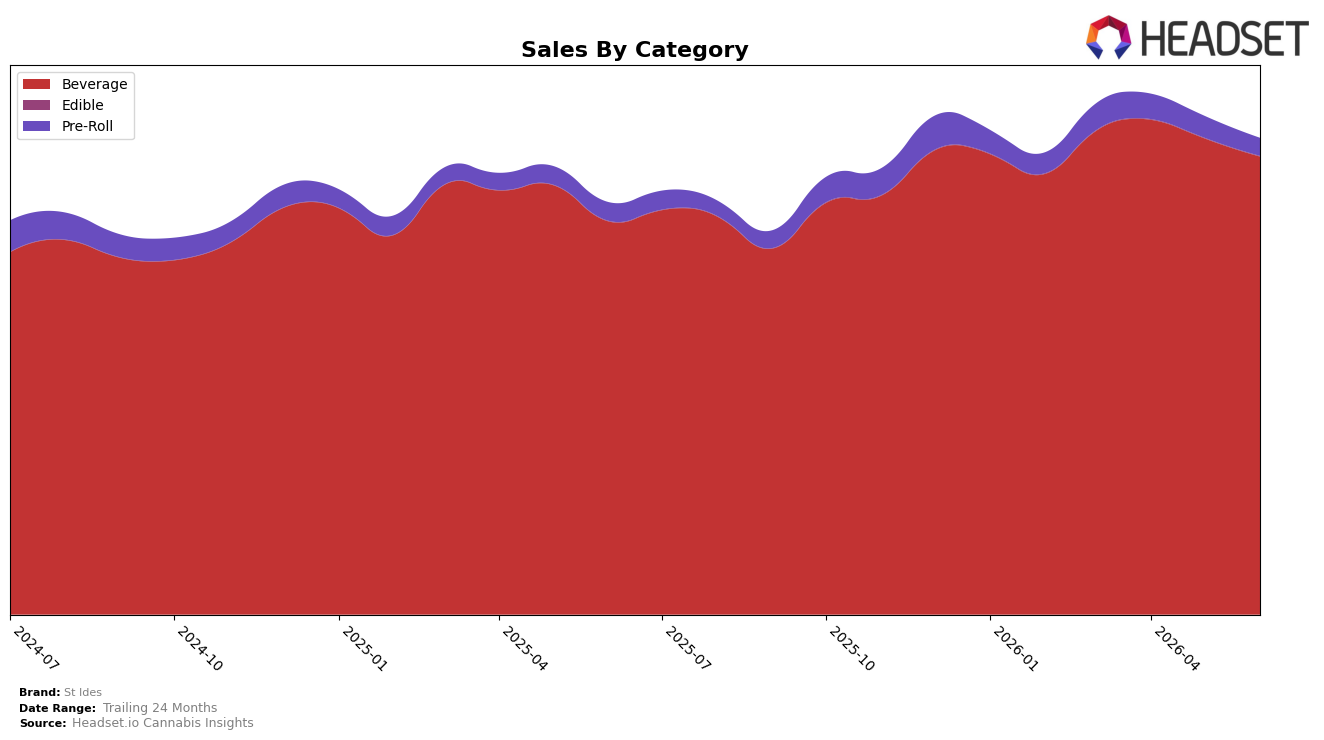
In June 2026, Beverage controlled 96.26% of St Ides sales with 16.49% year-over-year growth but a 3.80% month-over-month decline, while Pre-Roll held 3.70% with a 3.57% year-over-year contraction and an 18.07% month-over-month drop; Edible was 0.04% of sales with 63.43% year-over-year growth and 27.06% month-over-month growth. Average price rose 0.80% year over year to $7.52, with Beverage priced at $7.33 and Pre-Roll at $21.99, and St Ides ranked 1 in Beverage within California. The pattern implies over-reliance on Beverage for volume and rank while Pre-Roll is shrinking sequentially, so June 2026 performance hinges on stabilizing Beverage mix despite the month-over-month pullback and selectively nurturing Edible’s small but fast-growing niche.
Beverage’s 96.26% share paired with a rank of 1 in California anchors St Ides positioning, but the 3.80% month-over-month dip signals sensitivity to short-cycle demand that could pressure total share if repeated, particularly as Pre-Roll fell 18.07% month over month. With Edible up 27.06% month over month and 63.43% year over year from a 0.04% base, and Pre-Roll down 3.57% year over year, the mix suggests St Ides is concentrated in a lower-price Beverage lane and under-indexing in premium ticket formats; the implication is to defend Beverage rank while using Edible’s faster growth to diversify risk rather than chasing Pre-Roll recovery at current trajectories.
Competitive Landscape
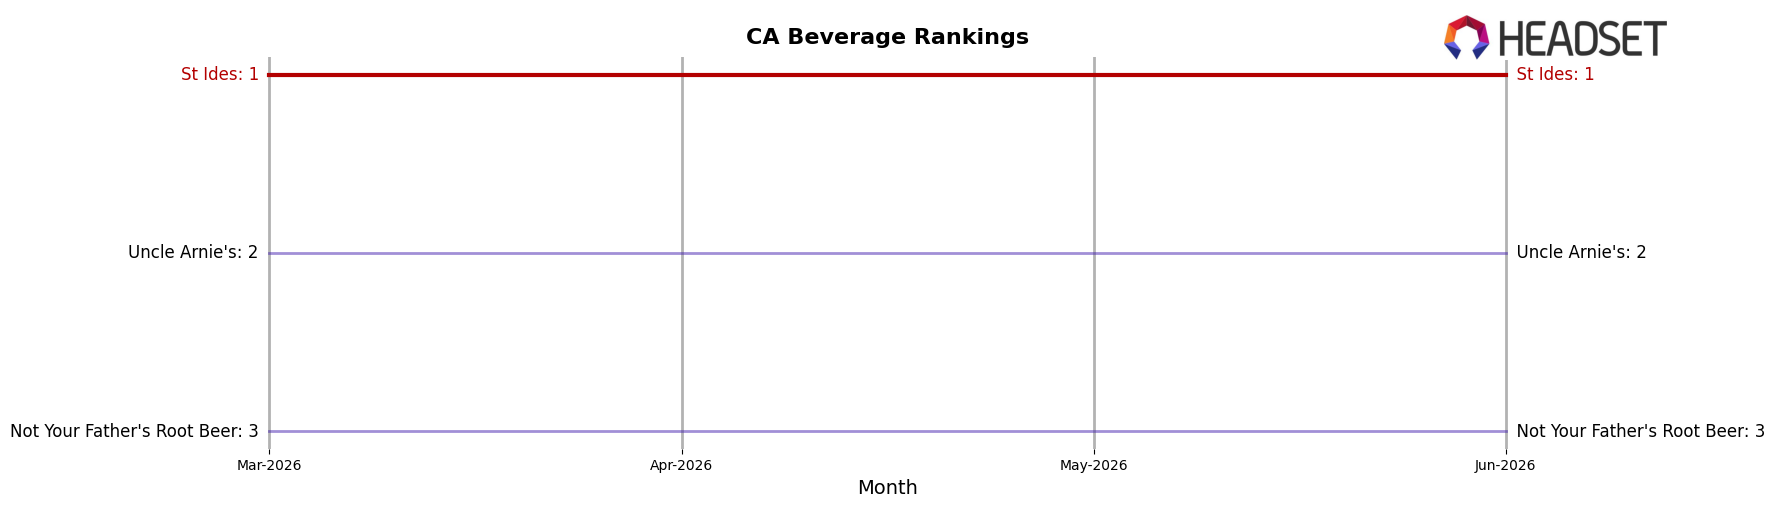
St Ides sits at rank #1 in CA Beverage in June 2026, unchanged from #1 year over year, with stability mirrored over the most recent three months at #1 and a peak rank of #1 in June 2026; by contrast, Uncle Arnie's held #2 both this year and last year while posting a 28.6% YoY sales increase, and CANN Social Tonics improved rank from #7 to #5 alongside 73.6% YoY growth, indicating that St Ides’ unchanged #1 position is being defended against faster climbers rather than widened, so the trajectory implies maintenance leadership with rising pressure from lower-ranked brands.
Notable Products
Wild Raspberry Iced High Tea (100mg THC, 12oz, 355ml) posted the standout move in June 2026 with a +164% month-over-month surge, rising to rank 1, while Lychee Pear High Tea (100mg THC, 12oz, 355ml) fell -12% and held rank 4. Georgia Peach High Tea (100mg THC, 12oz, 355ml) slipped -4% at rank 2 and Maui Mango Infused High Tea (100mg THC, 12oz, 355ml) declined -5% at rank 3, concentrating mixed momentum at the very top of the leaderboard. Eight of the top ten are High Tea beverages, indicating that a single flavor breakout is carrying the category’s leadership while secondary flavors cool, which implies St Ides is leaning into a flagship-led beverage strategy with selective flavor rotation rather than broad-based gains.
Top Selling Cannabis Brands
Data for this report comes from real-time sales reporting by participating cannabis retailers via their point-of-sale systems, which are linked up with Headset’s business intelligence software. Headset’s data is very reliable, as it comes digitally direct from our partner retailers. However, the potential does exist for misreporting in the instance of duplicates, incorrectly classified products, inaccurate entry of products into point-of-sale systems, or even simple human error at the point of purchase. Thus, there is a slight margin of error to consider. Brands listed on this page are ranked in the top twenty within the market and product category by total retail sales volume.

