Jun-2026
Sales
Trend
6-Month
Product Count
SKUs
Avg Price
YoY Sales Change
YoY Price Change
Market Insights Snapshot
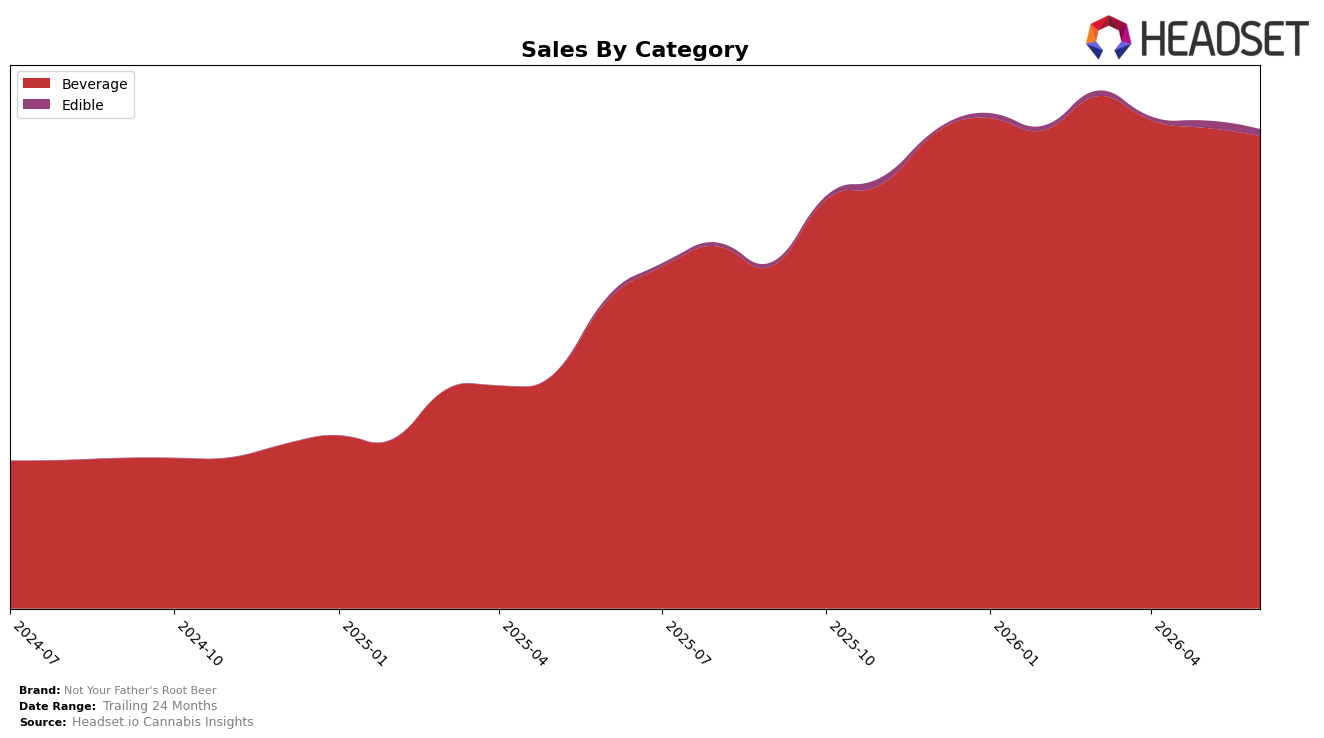
In June 2026, Not Your Father's Root Beer remained overwhelmingly concentrated in Beverage at 98.64% share while Edible held 1.36%, with Beverage up 53.09% year over year but down 1.70% month over month and Edible up 90.51% year over year but down 6.28% month over month. The brand’s total sales rose 53.50% year over year alongside a 3.29% reduction in average price, and within Beverage the average price held near $7.81 while Edible averaged $7.95; this mix, combined with a rank of 3 in Beverage in California, implies that volume expansion is being driven by Beverage even as short-term momentum softened sequentially.
The tilt toward Beverage (98.64% share) combined with Edible’s smaller but faster annual growth (90.51% YoY vs. Beverage’s 53.09% YoY) suggests the brand is consolidating its Beverage positioning while testing incremental reach through Edible despite a sharper month-over-month pullback in Edible at -6.28% versus Beverage at -1.70%. With a 3.29% lower average price coinciding with a 53.50% year-over-year sales increase and a #3 Beverage rank in California, the pattern implies price-led accessibility is supporting rank and share defense in Beverage, while the smaller Edible stake functions as an option for adjacency without materially shifting the core mix.
Competitive Landscape
Not Your Father's Root Beer sits at #3 in CA Beverage in June 2026, unchanged from #3 year over year, and it also held #3 three months ago, indicating flat rank momentum even as category dynamics shifted; meanwhile, St Ides held #1 with a 16.49% YoY sales increase and Uncle Arnie's held #2 with 28.58% YoY growth, while Almora Farms climbed from #6 to #4 and CANN Social Tonics moved from #7 to #5 on 73.62% YoY growth; the pattern implies that maintaining a peak rank of #3 in June 2026 without upward movement risks future share erosion as faster-rising rivals compress the gap.

Notable Products
Fruit Punch Soda (100mg THC, 16oz, 355ml) posted the steepest decline at -13.5% month over month and slid to rank 8, while Cherry Cola Live Resin Soda (100mg THC, 16oz) fell -8.2% at rank 3, signaling flavor extensions are cooling even as the flagship holds share. Root Beer Soda (100mg THC, 16oz, 355ml) remained at rank 1 despite a -3.2% dip, and the lower-dose Root Beer Soda (10mg THC, 12oz) rose 33.3% at rank 9, indicating the brand’s identity SKU is anchoring the lineup while trial migrates to sessionable formats.
Across the top ten, all SKUs are Beverages and four of the top five are Live Resin sodas, with CBD/THC 1:4 Orange Cream up 3.4% at rank 4 and CBD/THC 1:1 Orange Cream up 6.0% at rank 6, outpacing the -0.3% to -3.1% range for most non-Orange variants. This pattern implies June 2026 mix is tilting toward functional Live Resin and lower-dose root beer formats, suggesting near-term emphasis on dosage diversification over new flavor launches.
Top Selling Cannabis Brands
Data for this report comes from real-time sales reporting by participating cannabis retailers via their point-of-sale systems, which are linked up with Headset’s business intelligence software. Headset’s data is very reliable, as it comes digitally direct from our partner retailers. However, the potential does exist for misreporting in the instance of duplicates, incorrectly classified products, inaccurate entry of products into point-of-sale systems, or even simple human error at the point of purchase. Thus, there is a slight margin of error to consider. Brands listed on this page are ranked in the top twenty within the market and product category by total retail sales volume.

