.svg)
Sep-2026
Sales
Trend
6-Month
Product Count
SKUs
Avg Price
YoY Sales Change
YoY Price Change


Where to Buy
Uncle Arnie's is stocked at 954 licensed dispensaries across California, Michigan, and 7 other states, 493 of them in California, with the deepest coverage in Los Angeles, Sacramento, San Diego, San Francisco, and Santa Ana. Search by ZIP code or city below to find the closest one, or filter by product type if you are after a specific format.
Market Insights Snapshot
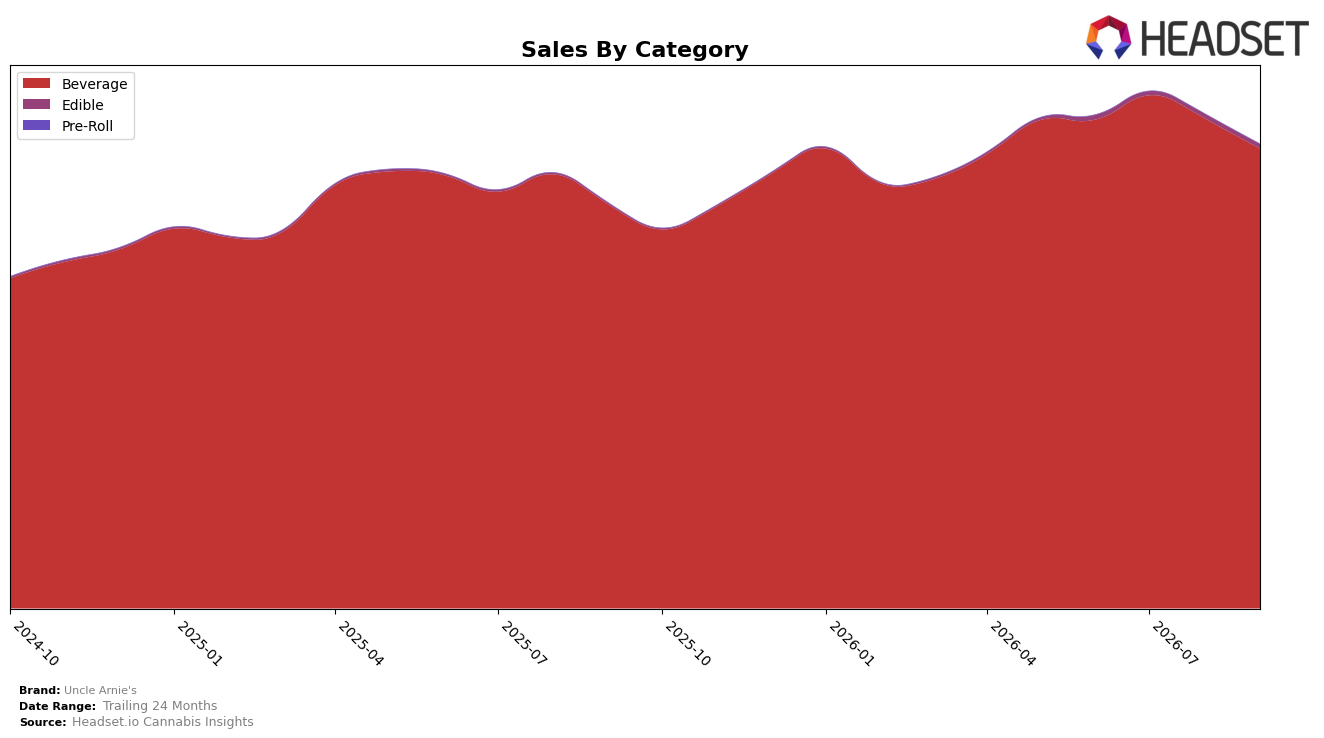
Uncle Arnie's concentrated further into Beverage, with a 99.13% share in September 2026 while Edible held 0.87%, as Beverage declined month over month by 6.18% but grew year over year by 13.82%. Edible expanded year over year by 278.67% yet slipped month over month by 0.52%, indicating trial-scale growth that did not offset Beverage’s monthly dip; alongside a 3.93% year-over-year drop in average price and a 14.52% brand-level year-over-year sales increase, the mix implies volume-led gains concentrated in low-priced Beverage while diversification remains small in absolute terms. This pattern implies the brand is leaning on Beverage volume to drive growth even as monthly sell-through softened, with Edible acting as an experimental adjacency rather than a revenue counterweight.
With Beverage growth at 13.82% year over year versus a 6.18% month-over-month pullback, and Edible up 278.67% year over year but still under 1% share, positioning skews toward high-frequency, price-sensitive Beverage buyers rather than broad multi-category presence. Given an average price decline of 3.93% year over year alongside a 14.52% brand sales lift and a 99.13% Beverage share, the portfolio strategy signals price elasticity capture in Beverage while Edible’s sub-1% footprint limits cross-category insulation against monthly volatility; this implies the brand’s near-term defensibility rests on maintaining Beverage rank and distribution density rather than expanding assortment breadth.
Competitive Landscape
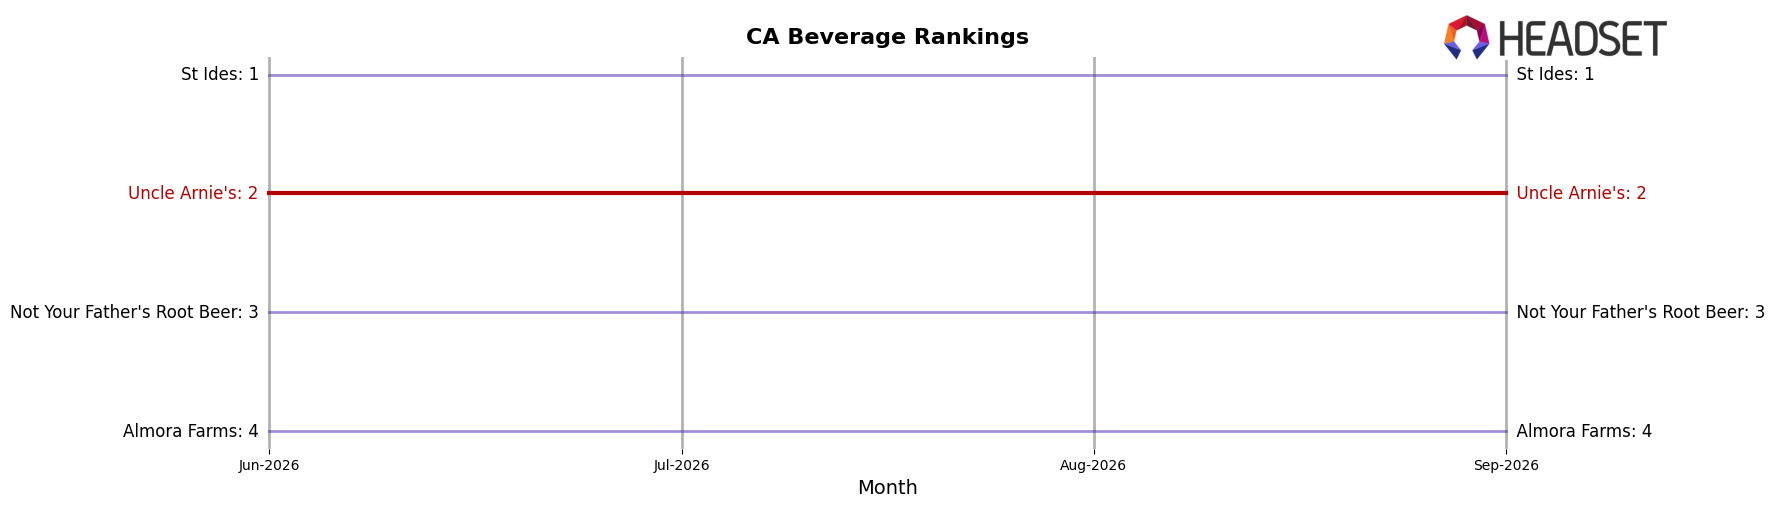
Uncle Arnie's sits at rank #2 in CA Beverage in September 2026 with no year-over-year rank change from #2, and no three-month movement from #2 either, while St Ides holds #1 with 15.3% YoY sales growth and CANN Social Tonics climbed from #9 to #5 with 340.8% YoY growth; at the same time, Almora Farms moved from #6 to #4 with 76.1% YoY growth and Not Your Father's Root Beer stayed at #3 with 34.5% YoY growth, indicating that Uncle Arnie's stable #2 despite faster-climbing neighbors signals entrenchment but rising pressure from below rather than an imminent push to #1.
Notable Products
Magic Mango Rosin Shot (100mg THC, 2oz) posted the sharpest movement in September 2026 with a -10.6% month-over-month drop and slid behind Strawberry Kiwi Shot (100mg THC, 2oz) at rank 3 versus the leader at rank 1, signaling demand is consolidating at the very top rather than expanding across flavors. Sunrise Orange With Caffeine Shot (100mg THC, 2oz) fell -6.9% month over month while holding rank 2, and Cherry Limeade Soda (100mg THC, 12oz) declined -10.8% at rank 10, indicating pressure on both a premium shot and a tail-end soda SKU at opposite ends of the ranking ladder. Nine of the top ten are Beverage sodas or shots, and the top five are all shots, with Strawberry Kiwi Shot (100mg THC, 2oz) nearly flat at -2.1% and CBN/THC 1:20 Blueberry Nightcap Shot (5mg CBN, 100mg THC, 2oz) effectively unchanged at -0.2%, pointing to shots as the anchor while sodas absorb broader softness around ranks 7–10.
Top Selling Cannabis Brands






Data for this report comes from real-time sales reporting by participating cannabis retailers via their point-of-sale systems, which are linked up with Headset’s business intelligence software. Headset’s data is very reliable, as it comes digitally direct from our partner retailers. However, the potential does exist for misreporting in the instance of duplicates, incorrectly classified products, inaccurate entry of products into point-of-sale systems, or even simple human error at the point of purchase. Thus, there is a slight margin of error to consider. Brands listed on this page are ranked in the top twenty within the market and product category by total retail sales volume.

