Jun-2026
Sales
Trend
6-Month
Product Count
SKUs
Avg Price
YoY Sales Change
YoY Price Change
Market Insights Snapshot
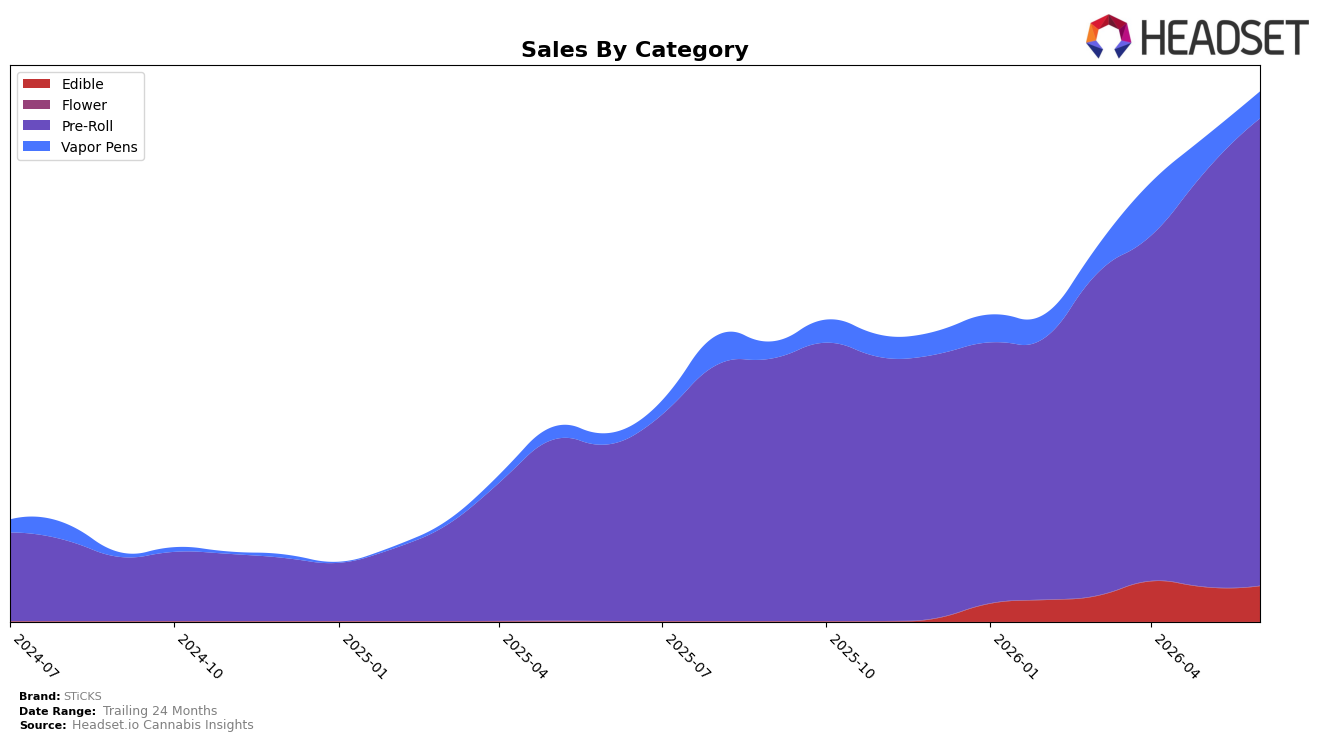
In June 2026, STiCKS concentrated 88.27% of sales in Pre-Roll, where year-over-year sales rose 164.98% and month-over-month grew 12.74%, while Vapor Pens held 5.04% share with a 146.57% year-over-year increase but a -23.39% month-over-month decline. Edible accounted for 6.69% share with a 3.09% month-over-month gain and no year-over-year baseline, and the brand’s average price rose 5.16% year-over-year to $4.82. With Pre-Roll ranked 1 in Oregon and gaining share alongside a simultaneous Vapor Pens pullback, the pattern implies a deliberate tilt toward Pre-Roll leadership and a cautious test-and-trim approach in non-core formats.
The mix shift—Pre-Roll up 12.74% month-over-month while Vapor Pens fell -23.39% month-over-month—signals prioritization of the category where STiCKS holds the #1 position in Oregon, reinforced by 164.98% year-over-year growth in that category versus a smaller 3.09% month-over-month rise in Edible. Coupled with a 5.16% year-over-year price lift and a 88.27% sales concentration in Pre-Roll, the brand is anchoring on a value-price lane in its core format while using Edible’s 6.69% share as a low-risk adjacency, implying a positioning strategy that defends Pre-Roll rank while trimming Vapor Pens exposure to protect margin and focus execution.
Competitive Landscape
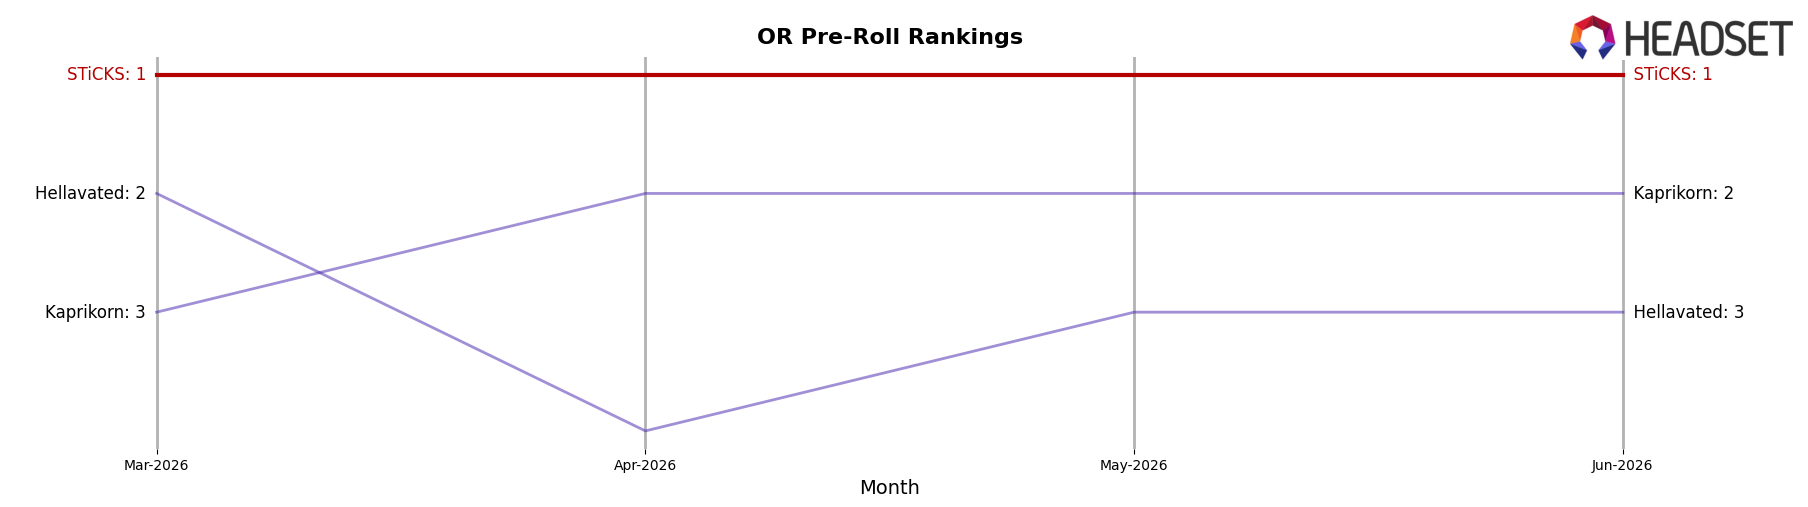
STiCKS holds rank #1 in OR Pre-Roll in June 2026 after improving 1 position year over year from #2, while maintaining #1 over the last three months and reaching its peak rank #1 in June 2026; in contrast, Kaprikorn climbed to #2 from #5 year over year with 113.4% sales growth, and Hellavated fell to #3 from #1 despite 15.9% sales growth. Further down, Portland Heights slid to #4 from #3 with a 26.3% sales decline and Benson Arbor moved to #5 from #4 with a 27.4% decline, indicating STiCKS’ ascent to #1 and persistence at #1 signal a defensive lead that relies more on holding position than widening distance as fast-rising #2 pressure intensifies.
Notable Products
Valley Purps Infused Pre-Roll (1g) posted the standout move with a 38.5% month-over-month gain to rank 5, while top-ranked Crater Lake Cookies Infused Pre-Roll (1g) rose 18.9% and Oregon Strawberries Infused Pre-Roll (1g) at rank 2 increased 4.5%. MT. Hood Magic Infused Pre-Roll (1g) climbed 26.2% to hold rank 3 as Bandon Gold Infused Pre-Roll (1g) advanced 25.7% at rank 4, and Blue Magoo Infused Pre-Roll (1g) ticked up 6.3% at rank 7. Nine of the top ten are Pre-Roll SKUs with no declines over -10%, and only one new entrant shows no prior-month baseline while Platinum Yeti Pre-Roll (1g) enters at rank 10 with $60,692 in June 2026 sales. The pattern implies STiCKS is concentrating volume in infused Pre-Rolls, using mid-pack SKUs with 25–38% growth to reinforce leadership at ranks 1–5 and push a portfolio tilt toward higher-velocity, flavor-led variants.
Top Selling Cannabis Brands
Data for this report comes from real-time sales reporting by participating cannabis retailers via their point-of-sale systems, which are linked up with Headset’s business intelligence software. Headset’s data is very reliable, as it comes digitally direct from our partner retailers. However, the potential does exist for misreporting in the instance of duplicates, incorrectly classified products, inaccurate entry of products into point-of-sale systems, or even simple human error at the point of purchase. Thus, there is a slight margin of error to consider. Brands listed on this page are ranked in the top twenty within the market and product category by total retail sales volume.

