Jun-2026
Sales
Trend
6-Month
Product Count
SKUs
Avg Price
YoY Sales Change
YoY Price Change
Market Insights Snapshot
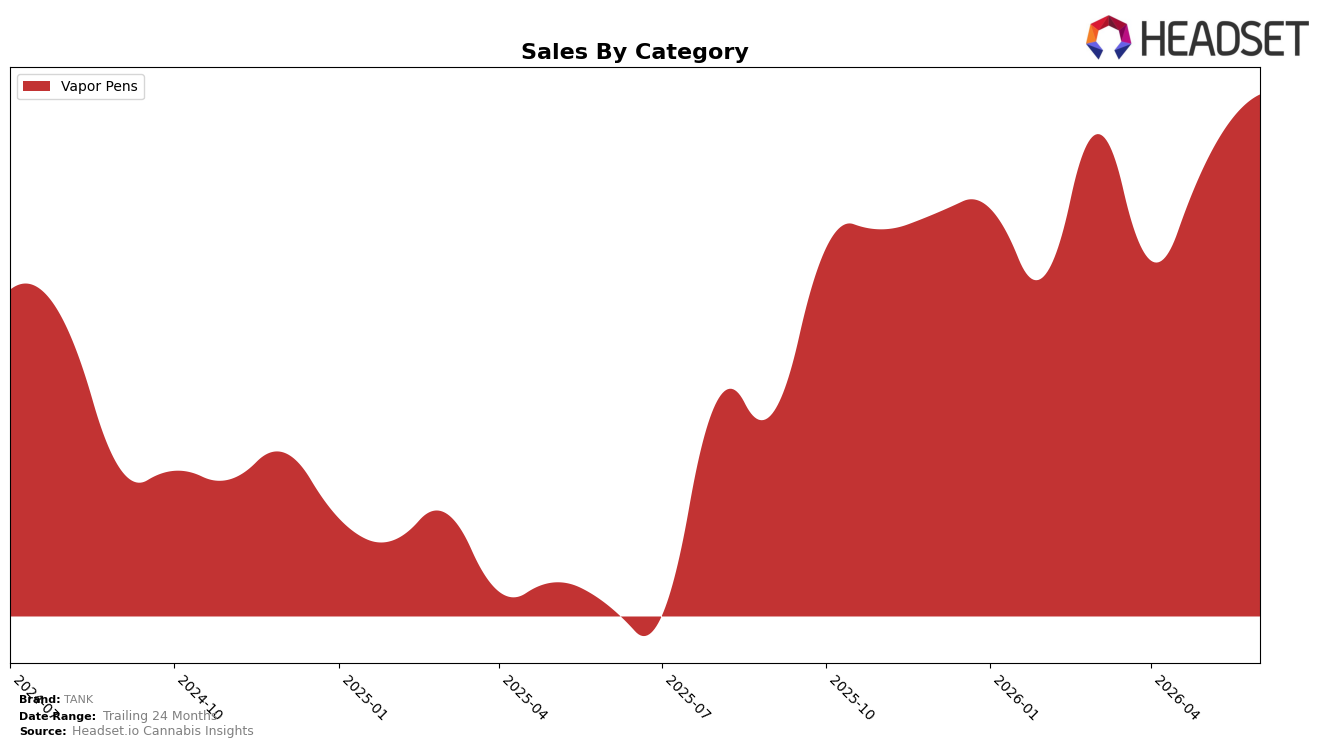
TANK’s category mix in June 2026 is fully concentrated in Vapor Pens at 100.0% share, with year-over-year sales up 138.99% and month-over-month sales up 8.74%. Average price sits at $33.38 with a year-over-year decline of 8.39%, indicating unit volume expansion outpacing price compression. Within Vapor Pens, the brand’s June 2026 rank is 6 in Missouri, pairing share consolidation (100.0%) with rank placement that leaves headroom above. The pattern implies that TANK is scaling primarily through volume within a single category while trading down on price, a setup that can support further rank gains if the 8.74% MoM trajectory offsets the 8.39% YoY price drag.
The concentration in Vapor Pens (100.0% mix) combined with a 6 rank in Missouri positions TANK as a focused specialist rather than a portfolio balancer, with 138.99% YoY growth signaling penetration depth rather than breadth. The 8.39% YoY price decline alongside an 8.74% MoM sales lift indicates a value-led stance that can pressure premium competitors while defending volume, and the 10.41% 24-month sales growth versus triple-digit 12-month growth suggests acceleration skewed to recent quarters. The implication is that TANK’s near-term positioning hinges on sustaining unit momentum in Vapor Pens to climb from rank 6, using price elasticity as the primary lever rather than category diversification.
Competitive Landscape
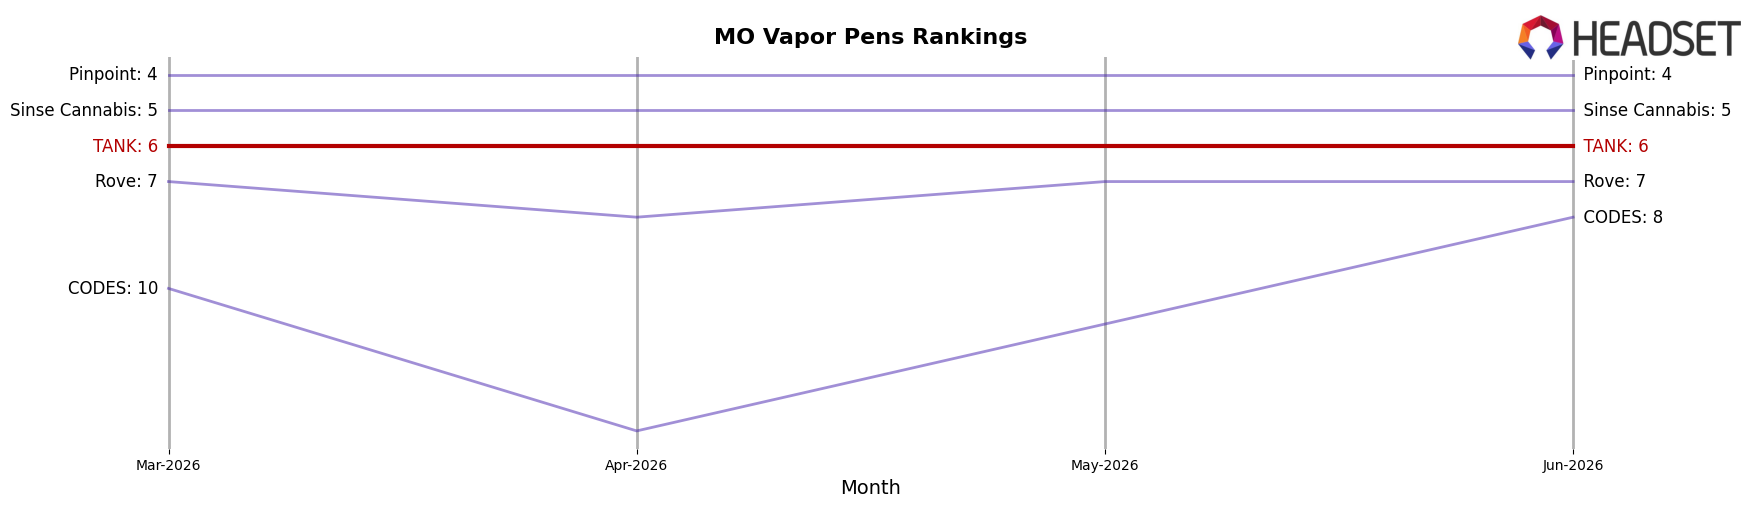
TANK sits at rank #6 in MO Vapor Pens in June 2026 after rising 13 positions year over year from #19, holding flat versus March 2026 at #6 while still trailing its peak of #3 from June 2024; by comparison, Illicit / Illicit Gardens stayed at #1 year over year with sales up 27.6%, and Good Day Farm climbed from #10 to #2 with sales up 78.8%. Against mid-pack movers, Pinpoint advanced from #7 to #4 on 72.0% sales growth while Sinse Cannabis improved from #9 to #5 on 41.4% growth, indicating TANK’s 13-rank YoY rebound has slowed into a holding pattern that risks ceding share to faster-climbing rivals unless momentum re-accelerates.
Notable Products
Paradise Petrol BDT Distillate Disposable (1g) posted the steepest decline in June 2026 at -12.6% MoM while sitting at rank 10, and Blueberry Underground BDT Distillate Disposable (1g) also fell -10.4% at rank 7, indicating disposables lost share even as the category remained concentrated with all ten top SKUs in Vapor Pens. In contrast, Lemon Whip Kush Distillate Cartridge (1g) climbed 43.1% MoM to rank 2 while Blueberry Underground BDT Distillate Cartridge (1g) rose 35.6% to hold rank 1, together pulling the cartridge subsegment ahead with one SKU over $278,000. Strawberry Brew BDT Distillate Cartridge (1g) slipped -7.5% to rank 3 while Berry Bloomz BDT Distillate Disposable (1g) advanced 20.3% to rank 6, showing momentum is concentrated in a few cartridge leaders rather than broadly across flavors. The pattern implies TANK is tilting its mix toward 1g cartridges with outsized MoM gains at the very top, while deprioritizing or repositioning slower disposable formats.
Top Selling Cannabis Brands
Data for this report comes from real-time sales reporting by participating cannabis retailers via their point-of-sale systems, which are linked up with Headset’s business intelligence software. Headset’s data is very reliable, as it comes digitally direct from our partner retailers. However, the potential does exist for misreporting in the instance of duplicates, incorrectly classified products, inaccurate entry of products into point-of-sale systems, or even simple human error at the point of purchase. Thus, there is a slight margin of error to consider. Brands listed on this page are ranked in the top twenty within the market and product category by total retail sales volume.

