.svg)

Aug-2026
Sales
Trend
6-Month
Product Count
SKUs
Avg Price
YoY Sales Change
YoY Price Change


Where to Buy
Safe Bet is stocked at 141 licensed dispensaries across Missouri, with the deepest coverage in Kansas City, St. Louis, Columbia, Springfield, and Cape Girardeau. Search by ZIP code or city below to find the closest one, or filter by product type if you are after a specific format.
Market Insights Snapshot
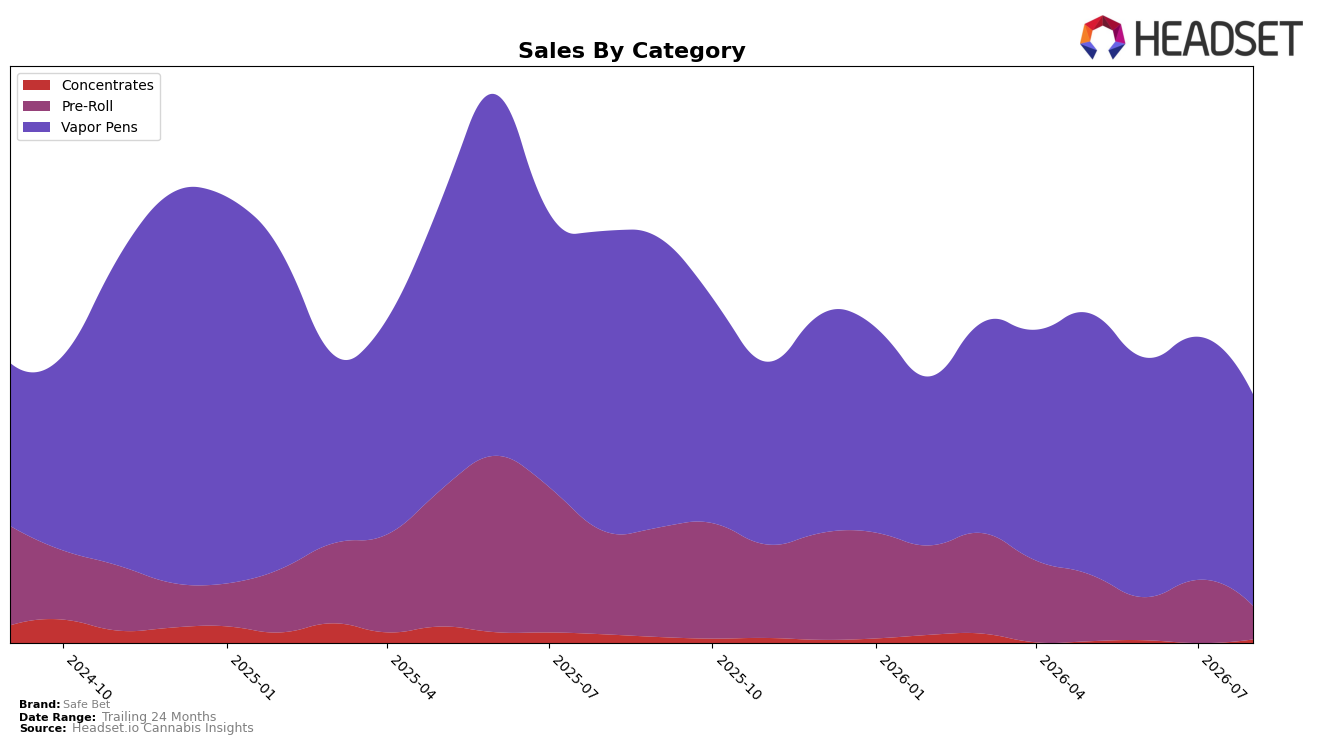
Safe Bet’s category mix in August 2026 was concentrated in Vapor Pens at 78.59% share, with year-over-year sales down 28.45% and month-over-month down 12.42%, while Pre-Roll held 15.90% share but contracted more sharply at -60.64% YoY and -39.63% MoM. Concentrates represented 5.51% share with -24.57% YoY but a 30.87% MoM increase, and the brand’s average price fell 22.05% YoY to $29.42, aligning with category declines and a share shift toward lower-priced formats. The pattern implies a portfolio leaning heavily on a shrinking Vapor Pens base and an acutely pressured Pre-Roll segment, offset at the margin by a rebound in Concentrates, which suggests short-term stabilization depends on sustaining Concentrates’ MoM gains while containing further Pre-Roll erosion.
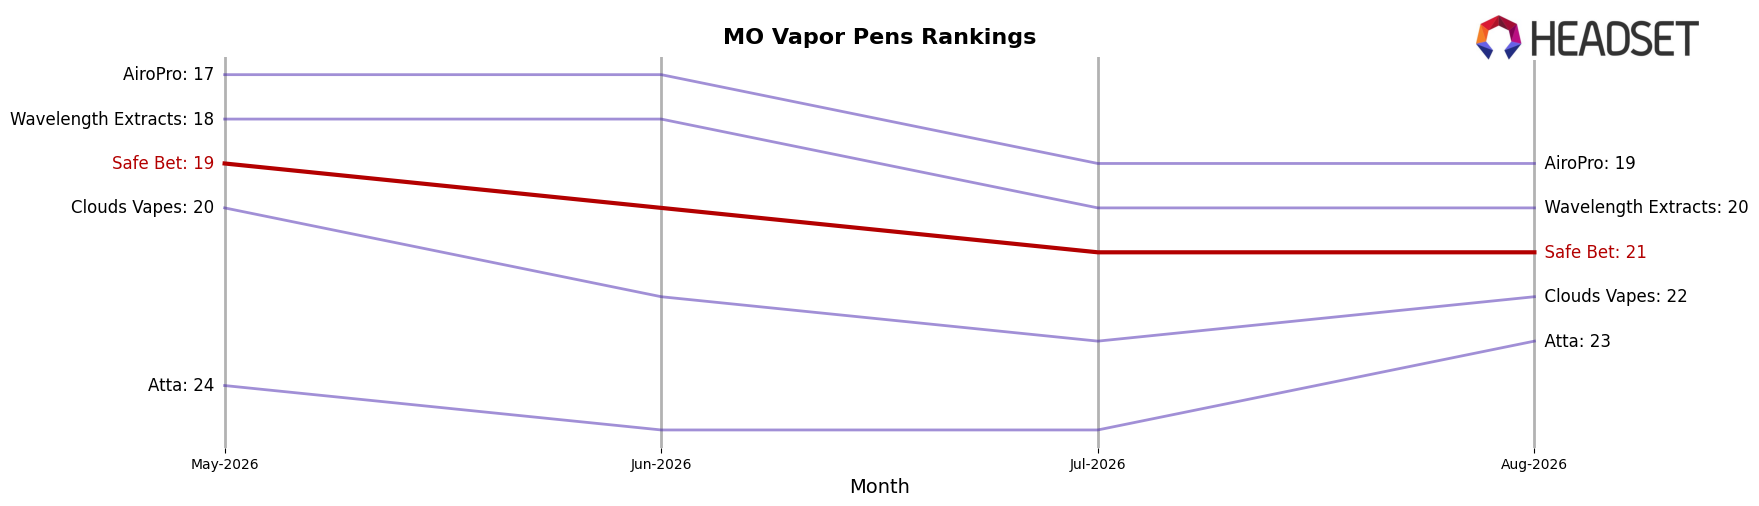
Within Missouri Vapor Pens, Safe Bet ranked 21, indicating mid-pack placement despite a 12.42% MoM decline in its primary category and a concurrent 39.63% MoM drop in Pre-Roll that reduces cross-category traffic. The 30.87% MoM growth in Concentrates alongside a -24.57% YoY decline signals emerging traction in a niche that could diversify reliance on Vapor Pens’ 78.59% share, while the 22.05% YoY price decrease suggests a value posture that may sustain rank but compress revenue velocity. The implication is a positioning pivot: maintain rank in Vapor Pens through price-pack architecture while intentionally growing Concentrates as a second pillar to buffer Pre-Roll volatility and reduce dependence on a single category.
Competitive Landscape
Safe Bet is currently ranked #21 in MO Vapor Pens in August 2026, down 2 positions year over year from #19, with a 2-position slide also from May 2026 to August 2026 indicating stagnation versus peers; meanwhile, Illicit / Illicit Gardens advanced from #2 to #1 and Galactic moved from #3 to #2, while Safe Bet’s peak at #13 in January 2025 now sits 8 ranks higher than its current level, reinforcing a downward gap. The directional contrast—competitors climbing 1 rank and 1 rank respectively as Safe Bet falls 2 ranks YoY—implies that Safe Bet’s trajectory risks entrenching it outside the top 20 unless it reclaims share from brands that are converting rank gains into compounded shelf visibility.
Notable Products
Granddaddy Purple Distillate Cartridge (1g) posted the steepest decline in August 2026 at -20.9% MoM while sliding to rank 3, paired with Blue Dream Distillate Cartridge (1g) down -30.6% MoM at rank 4, indicating demand rotated away from legacy strains. In contrast, Green Crack Distillate Cartridge (1g) rose +31.8% MoM to rank 1 with $60,706 in sales, outpacing Pineapple Express Distillate Cartridge (1g) at -9.0% MoM in rank 5 and AK-47 Distillate Cartridge (1g) at -14.6% MoM in rank 7, signaling a share shift toward a single hero SKU. With nine of the top ten SKUs in Vapor Pens and the lone Pre-Roll holding rank 6 without a reported MoM rate, the lineup is consolidated around cartridges even as performance bifurcates between one gainer and multiple double‑digit decliners. The pattern implies Safe Bet’s commercial direction is concentrating on a flagship cartridge to drive velocity while legacy pen SKUs require SKU pruning or repositioning to prevent cannibalization.
Top Selling Cannabis Brands






Data for this report comes from real-time sales reporting by participating cannabis retailers via their point-of-sale systems, which are linked up with Headset’s business intelligence software. Headset’s data is very reliable, as it comes digitally direct from our partner retailers. However, the potential does exist for misreporting in the instance of duplicates, incorrectly classified products, inaccurate entry of products into point-of-sale systems, or even simple human error at the point of purchase. Thus, there is a slight margin of error to consider. Brands listed on this page are ranked in the top twenty within the market and product category by total retail sales volume.

