Market Insights Snapshot
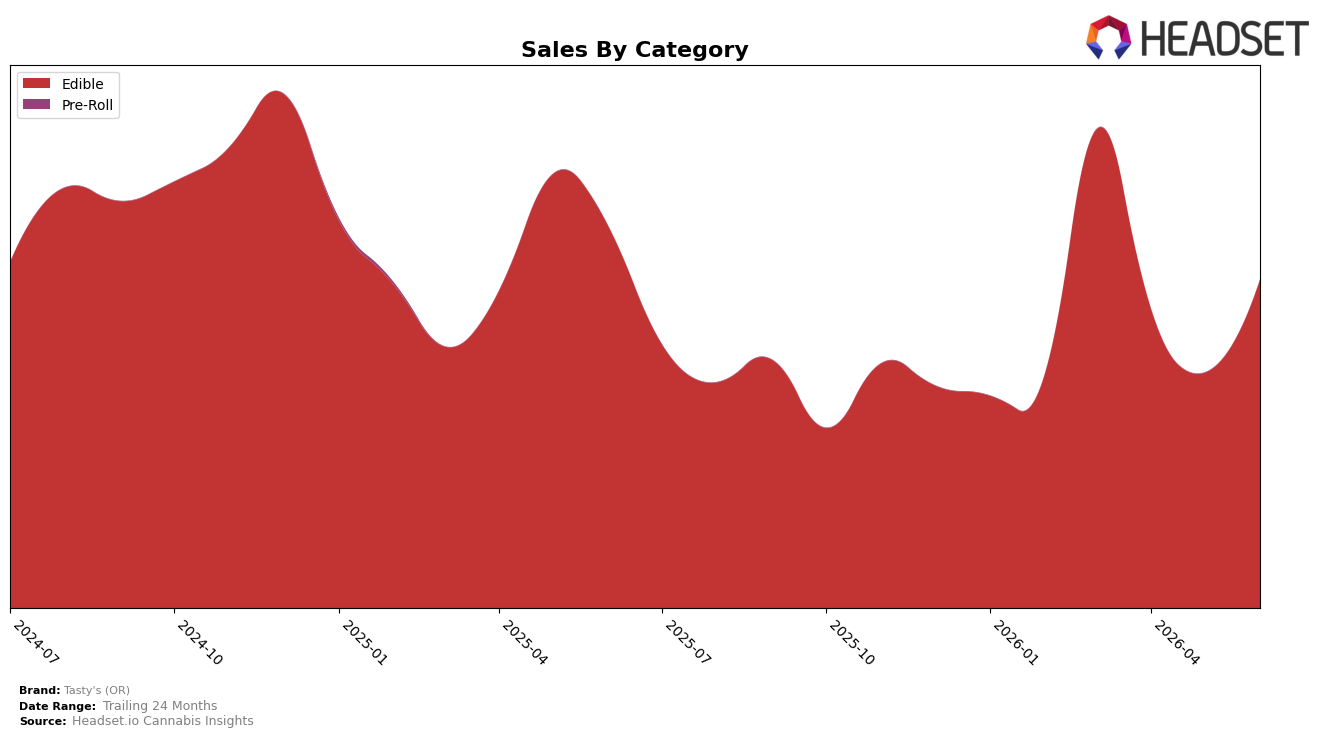
In June 2026, Tasty's (OR) operated as a single-category brand with Edible at 100.0% of mix, rising 39.6% month over month while declining 14.1% year over year. Average price decreased 3.2% YoY alongside a MoM volume lift implied by the 39.6% sales increase at flat category mix, and the brand held rank 25 in Edible within Oregon. The thesis is that a concentrated Edible-only footprint paired with a tactical price reduction is driving short-term MoM recovery but not yet reversing the YoY drag.
The 100.0% reliance on Edible, combined with a 14.1% YoY sales decline and a 3.2% YoY price cut, implies a price-led defense rather than a diversified growth strategy, even as June 2026 delivered a 39.6% MoM spike. Holding rank 25 in Oregon Edibles suggests mid-pack positioning where incremental price moves can shift volume but may cap margin leverage; to change trajectory, Tasty's (OR) would need either higher-value Edible subsegments or new category entry to decouple volume from continued discounting. The thesis is that sustained share gains will require mix or tier repositioning, not just price-driven MoM surges.
Competitive Landscape
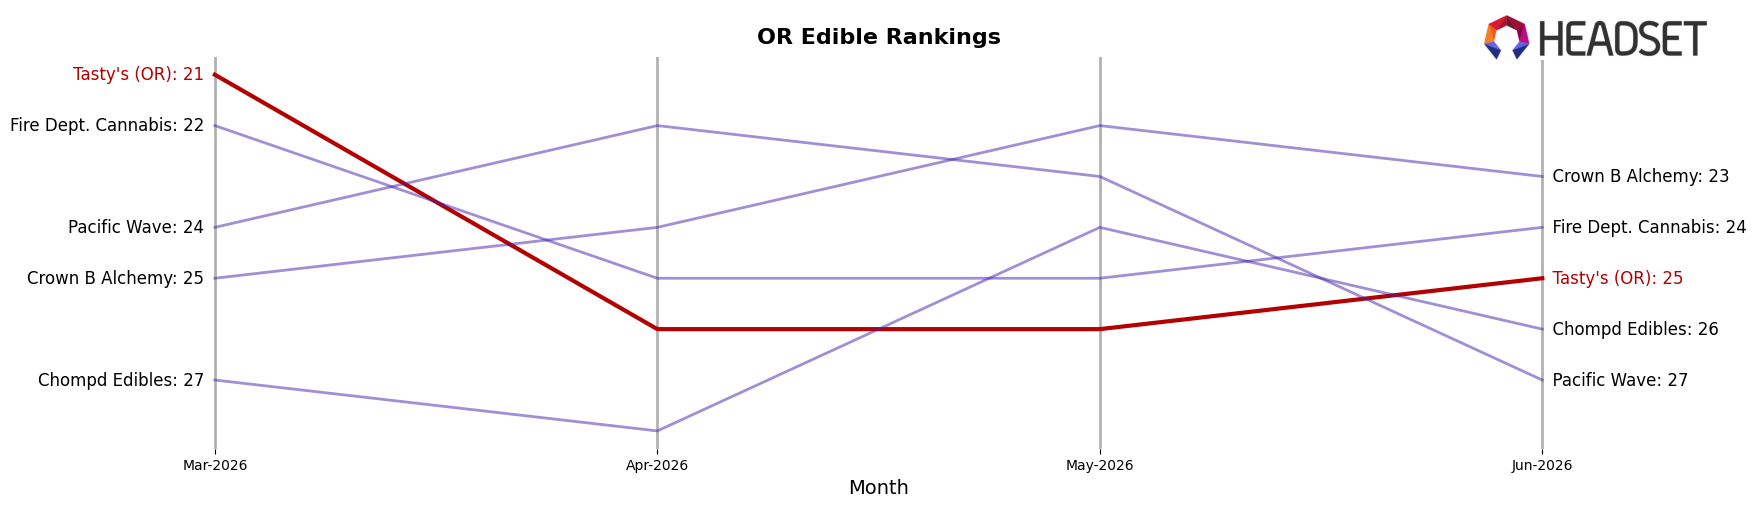
Tasty's (OR) sits at #25 in June 2026, down 2 positions from #23 in June 2025, and 4 spots below its March 2026 peak at #21, while category leaders are consolidating: Wyld held #1 with a 45.3% year-over-year sales increase as Gron / Grön stayed #2 despite a 104.6% sales decline, and Good Tide stayed #4 with an 88.9% lift. The contrast between Tasty's (OR) slipping 2 ranks year over year and Drops holding #3 despite a 4.4% decline, plus Mule Extracts maintaining #5 amid an 11.6% drop, implies Tasty's (OR) is losing relative position not due to broad category contraction but because stable incumbents are either growing or defending ranks even with negative sales percentages, pointing to a trajectory where further share erosion is likely without a rank recovery catalyst.
Notable Products
Sativa Pineapple Gummy (100mg) delivered the headline move with a +194.8% month-over-month surge to rank 1 in June 2026, while Sour Peach Greenlit High Dose Gummy 10-Pack (100mg) also accelerated +135.0% to rank 3, indicating momentum at both the top and within high-dose formats. Black Cherry Live Resin Hard Candies 10-Pack (100mg) climbed +80.4% into rank 7, and Grape Gummy (100mg) advanced 33.2% at rank 2, concentrating share among fast-growing fruit flavors with three SKUs inside the top three ranks. Eight of the top ten are Edible SKUs, and the category’s depth includes two tied rank positions (7 and 8), implying assortment breadth rather than a single-SKU spike. The pattern suggests Tasty's (OR) is pivoting toward flavor-led Edible dominance with emphasis on high-dose and live resin variants to anchor premium velocity.
Top Selling Cannabis Brands
Data for this report comes from real-time sales reporting by participating cannabis retailers via their point-of-sale systems, which are linked up with Headset’s business intelligence software. Headset’s data is very reliable, as it comes digitally direct from our partner retailers. However, the potential does exist for misreporting in the instance of duplicates, incorrectly classified products, inaccurate entry of products into point-of-sale systems, or even simple human error at the point of purchase. Thus, there is a slight margin of error to consider. Brands listed on this page are ranked in the top twenty within the market and product category by total retail sales volume.

