Market Insights Snapshot
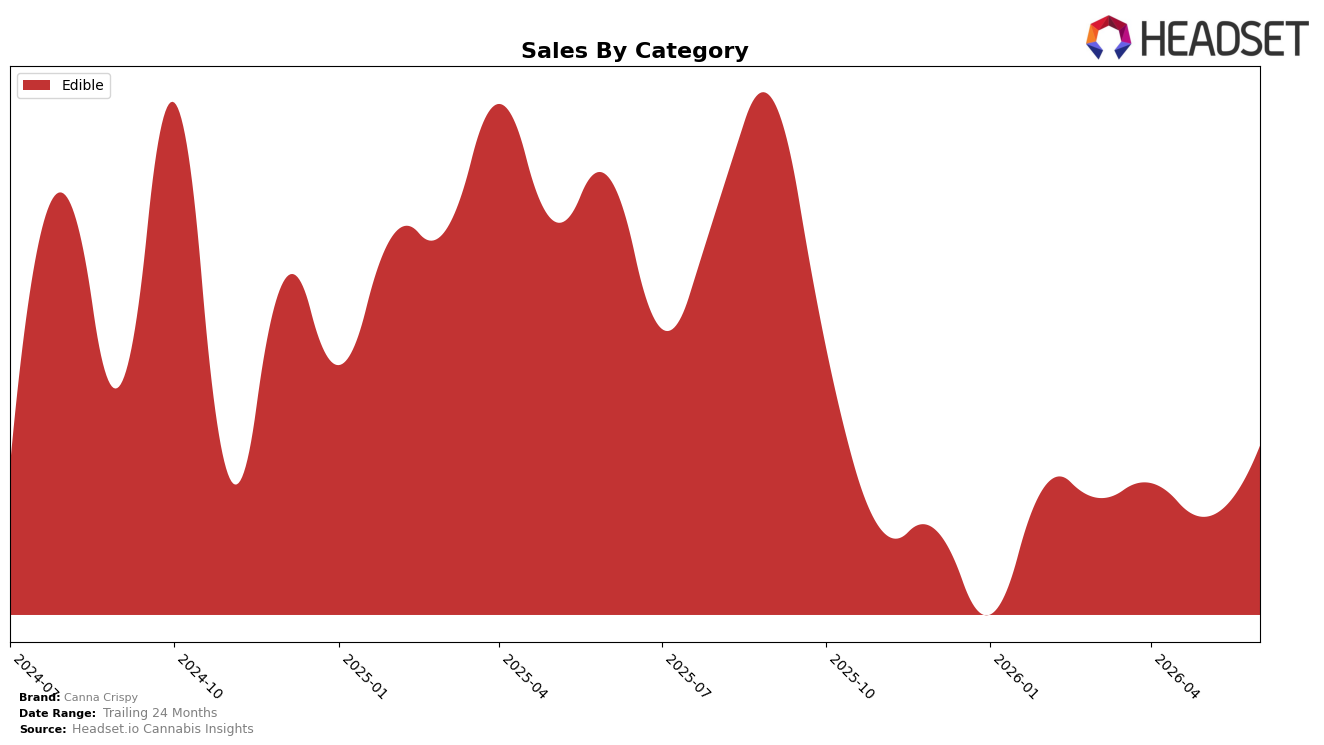
In June 2026, Canna Crispy’s mix is fully concentrated in Edible at 100.0% share, with year-over-year sales down 26.6% and month-over-month up 10.6%. Average price fell 7.1% YoY while remaining entirely within Edible, and the brand held rank 28 in Oregon Edible. The pattern implies a single-category dependency where short-term momentum (10.6% MoM) is counterbalancing a deeper annual contraction (-26.6% YoY), leaving the brand exposed to Edible-specific volatility rather than diversified category offsets.
The shift toward lower average price alongside a 10.6% MoM rebound in June 2026 suggests price-led volume capture within Edible, but the -26.6% YoY indicates that this tactic has not reversed annual share erosion. Holding rank 28 in Oregon Edible while maintaining a 100.0% category concentration implies Canna Crispy is competing primarily on price within a mid-pack position, and the strategy likely trades margin for incremental rank stability rather than expanding category footprint.
Competitive Landscape
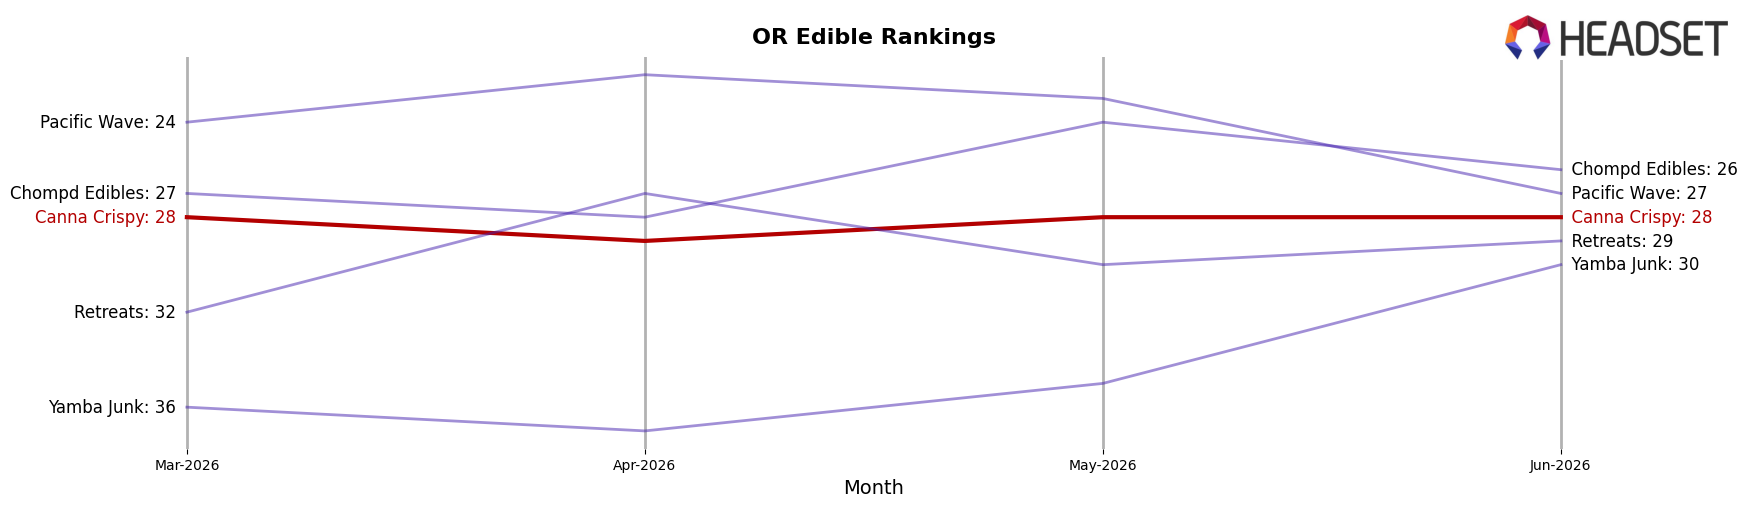
Canna Crispy sits at rank #28 in OR Edible for June 2026, unchanged from #28 year over year, and also flat versus March 2026 at #28, while its peak of #23 in September 2025 marks a 5-position slide since that high. In contrast, Wyld held #1 both year over year and in June 2026 alongside a 45.3% YoY sales increase, and Gron / Grön remained #2 despite a 104.6% YoY sales decline, indicating Canna Crispy’s static rank did not capitalize on volatility above it. With Good Tide at #4 with an 88.9% YoY sales increase and Mule Extracts at #5 with an 11.6% YoY decline, the mix of gains and drops among leaders alongside Canna Crispy’s zero-position YoY change implies a consolidation phase where maintaining #28 without share-accretive moves risks longer-run drift away from the prior #23 peak.
Notable Products
Indica Chocolate Crispy Treat (100mg) posted the largest movement in June 2026 with an 80.4% month-over-month surge to rank 2, while Sativa Fruity Crispy Treat (100mg) held rank 1 despite a 10.0% decline. Sativa Strawberry Crispy Treats (100mg) climbed 54.8% to rank 3, but Hybrid Original Crispy Treat (100mg) fell 31.4% to rank 5, indicating a split where growth concentrated in Indica and Sativa flavors while Hybrid variants lost share. Eight of the top ten are Edible SKUs, and the category mix pairs high-velocity Indica gains with multiple Hybrid declines of 15.4% to 31.4%, implying a pivot toward flavor-forward strain lines and away from legacy Hybrid anchors. The pattern suggests Canna Crispy is tilting assortment and promotion toward Indica and Sativa profiles that convert momentum at the top ranks while trimming exposure to underperforming Hybrid formats.
Top Selling Cannabis Brands
Data for this report comes from real-time sales reporting by participating cannabis retailers via their point-of-sale systems, which are linked up with Headset’s business intelligence software. Headset’s data is very reliable, as it comes digitally direct from our partner retailers. However, the potential does exist for misreporting in the instance of duplicates, incorrectly classified products, inaccurate entry of products into point-of-sale systems, or even simple human error at the point of purchase. Thus, there is a slight margin of error to consider. Brands listed on this page are ranked in the top twenty within the market and product category by total retail sales volume.

