Market Insights Snapshot
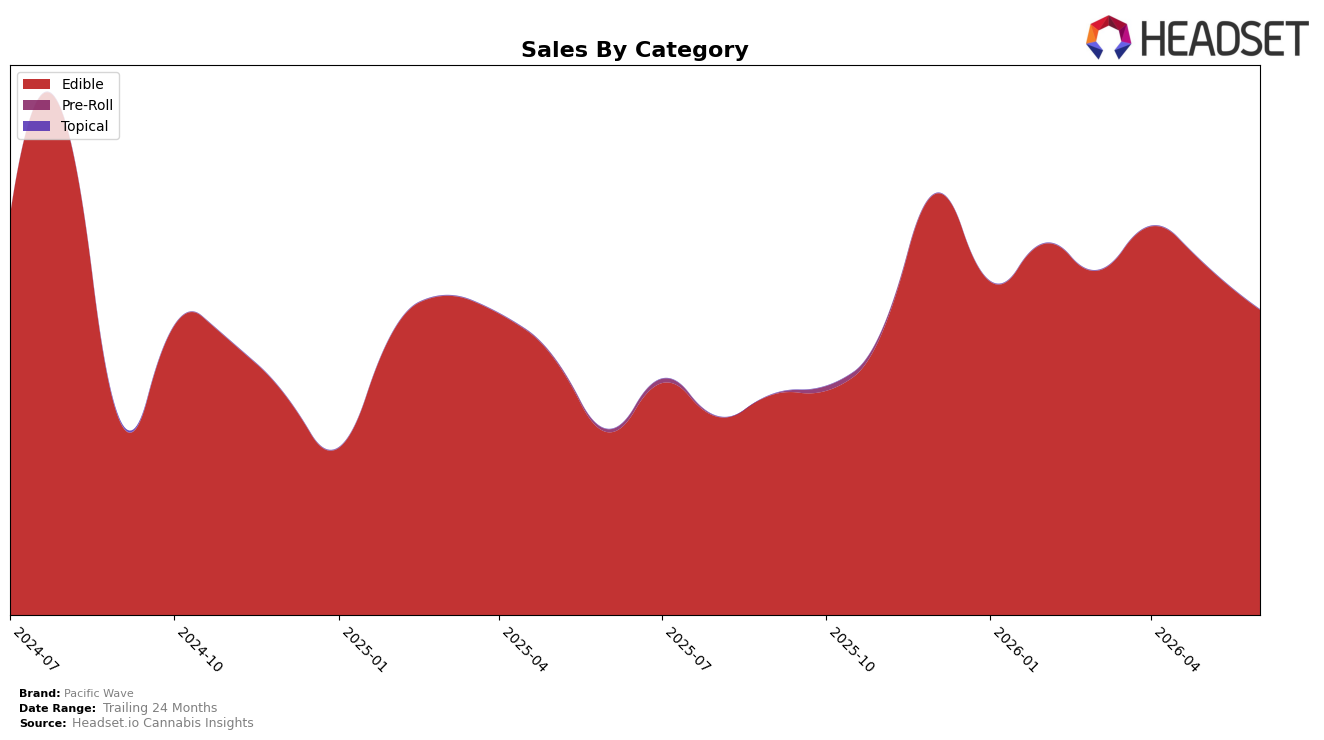
In June 2026, Pacific Wave operated as a single-category brand with Edible accounting for 100.0% of mix, concentrating all gains and risks in one lane; within Edible, year-over-year sales rose 67.14% while month-over-month contracted 12.98%, indicating a demand upswing on a longer arc alongside a short-term pullback. The brand’s average price declined 12.15% year over year to $3.83 while total brand sales advanced 64.84% YoY, pairing unit-led expansion with price compression; within the Oregon Edible set, a rank of 27 situates the brand mid-pack and implies volume is carrying share more than premium positioning right now.
The combination of a 12.98% month-over-month dip against a 67.14% year-over-year climb suggests Pacific Wave is trading into repeatable value at lower price points rather than seasonal spikes, with pricing elasticity aiding share capture but exposing near-term volatility. With 100.0% of revenue in Edible and a 27 rank in Oregon Edibles, the pathway to durable placement likely relies on tightening price architecture to moderate the 12.15% YoY price decline while defending unit velocity, as the current setup signals a value-led stance that can win baskets in Oregon but leaves the brand sensitive to promotional cycles and limited cross-category insulation.
Competitive Landscape
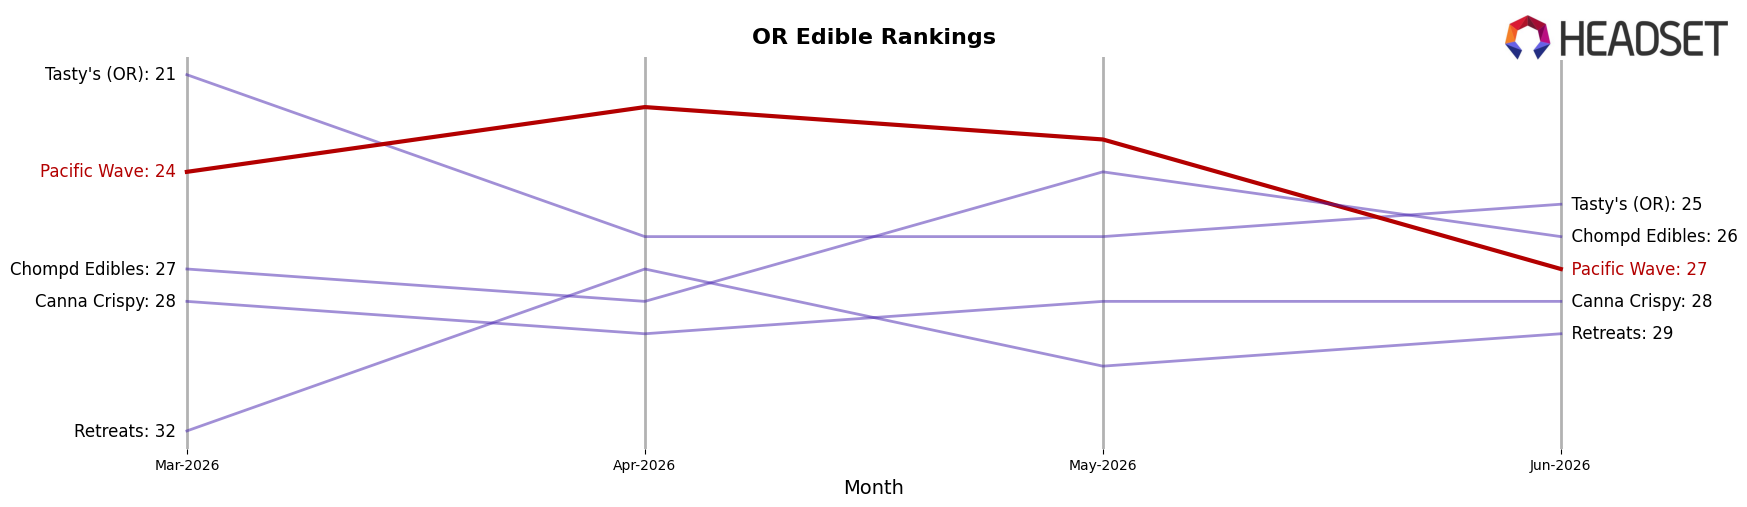
Pacific Wave sits at rank #27 in OR Edible for June 2026, a 6-position improvement from #33 year over year, but down 3 spots from #24 in March 2026; the brand’s peak of #21 in July 2024 frames this as a partial rebound rather than a full recovery. Against category leaders, Wyld held #1 year over year and currently, with an estimated +45% YoY sales change, while Gron / Grön stayed at #2 as its sales declined about 105% YoY, indicating a divergent top-tier dynamic; this contrast suggests Pacific Wave’s move from #33 to #27 is happening amid both acceleration at the very top and contraction just below it. The pattern implies Pacific Wave’s rank trajectory is improving but capped by a widening gap to the #1 position and an opportunity to displace weakening incumbents around the top five.
Notable Products
Blue Raspberry Galactic Gummies 10-Pack (100mg) posted the steepest decline in June 2026 at -31.1% MoM while sliding to rank 2, and Orange Giggly Gummies 10-Pack (100mg) fell even harder at -33.8% MoM from a lower base while holding rank 7. At the top, Strawberry Giggly Gummy (50mg) stayed at rank 1 despite a -5.6% MoM dip, and Strawberry Giggly Gummies 10-Pack (100mg) dropped -42.4% MoM while sitting at rank 8. With all top ten slots concentrated in Edibles and multiple 100mg multipack SKUs retreating while a 50mg single-serving leader holds share, the pattern implies Pacific Wave’s product mix is tilting toward lower-dose convenience rather than bulk potency.
Top Selling Cannabis Brands
Data for this report comes from real-time sales reporting by participating cannabis retailers via their point-of-sale systems, which are linked up with Headset’s business intelligence software. Headset’s data is very reliable, as it comes digitally direct from our partner retailers. However, the potential does exist for misreporting in the instance of duplicates, incorrectly classified products, inaccurate entry of products into point-of-sale systems, or even simple human error at the point of purchase. Thus, there is a slight margin of error to consider. Brands listed on this page are ranked in the top twenty within the market and product category by total retail sales volume.

