Jun-2026
Sales
Trend
6-Month
Product Count
SKUs
Avg Price
YoY Sales Change
YoY Price Change
Market Insights Snapshot
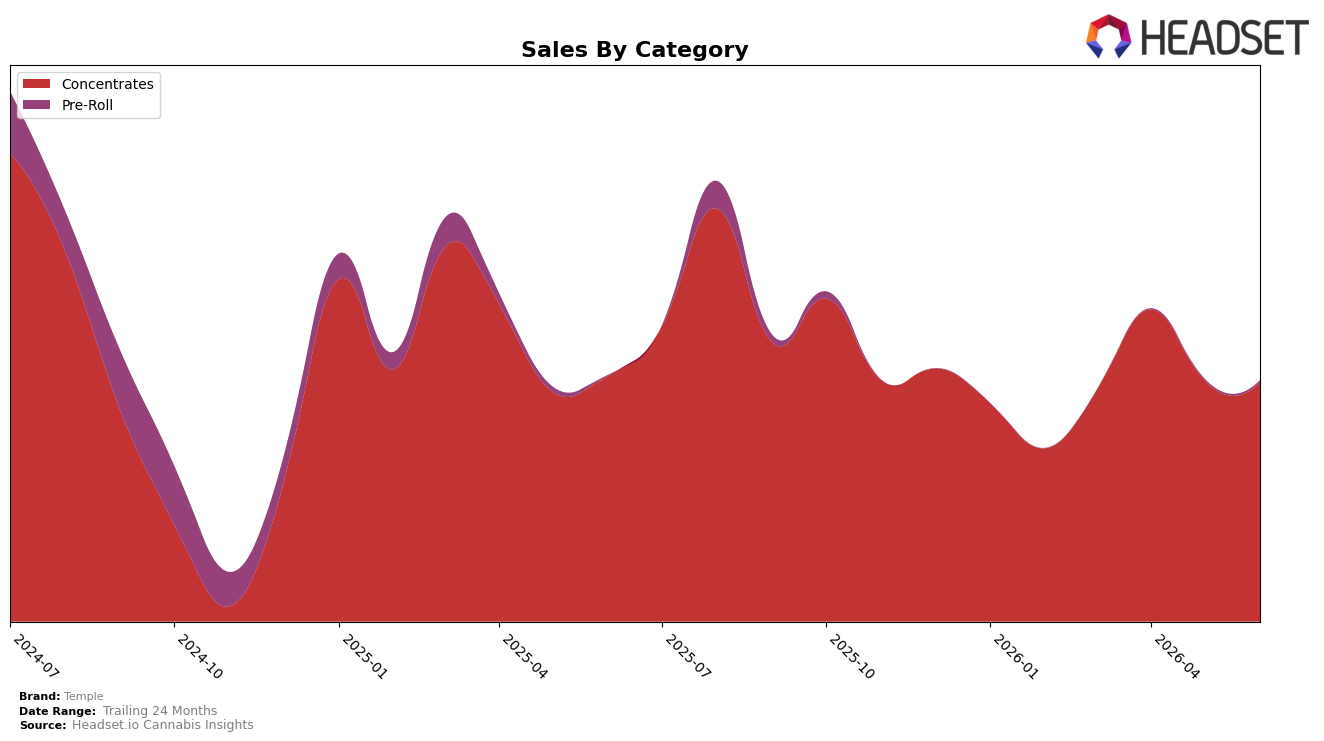
Temple’s category mix in June 2026 concentrated 99.25% of sales in Concentrates, where year-over-year change was -2.74% and month-over-month change was -0.83%, while Pre-Roll held 0.75% share with a 230.52% year-over-year increase and 31.83% month-over-month rise. Despite a -2.22% brand-level year-over-year sales change and a -1.48% average price shift, the concentration in Concentrates aligns with a June 2026 rank of 21 in Concentrates in Maryland; the thesis is that incremental Pre-Roll gains are not yet large enough to offset small declines in the dominant Concentrates base, so mix risk remains tied to a single category.
The mix shift implies positioning remains anchored to Concentrates, where a -2.74% year-over-year dip and -0.83% month-over-month dip constrain overall momentum, while the Pre-Roll expansion, despite 230.52% year-over-year and 31.83% month-over-month growth, contributes too little at 0.75% share to change trajectory. With a -42.48% 24‑month sales change and average prices near $48.64, Temple’s June 2026 footprint signals reliance on a single-category playbook that caps rank mobility at 21 in Maryland; the thesis is that gaining material share requires either deepening conversion within Concentrates or scaling the emergent Pre-Roll line to a multi-point share.
Competitive Landscape
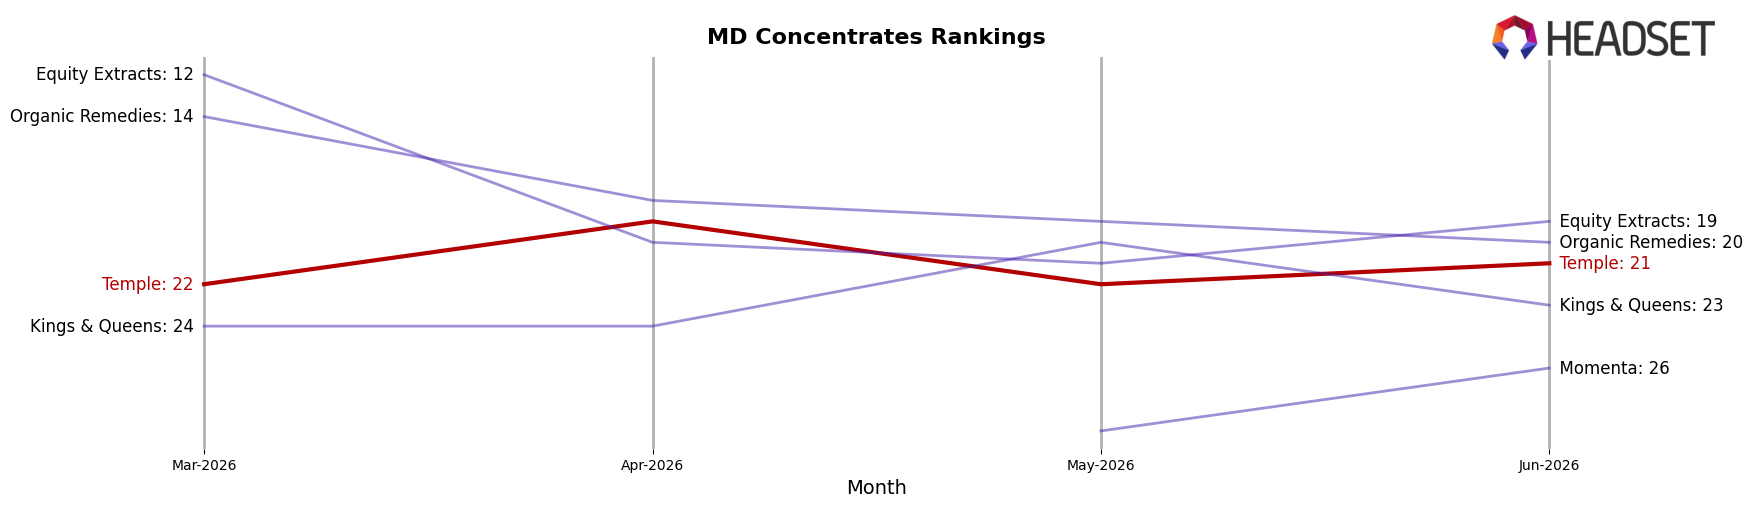
Temple sits at rank #21 in June 2026, improving 1 position from #22 year over year, but it remains 4 spots below its peak at #17 from August 2025 and only 1 spot better than its March 2026 mark at #22; meanwhile, District Cannabis held #1 with a 35.7% YoY sales increase and Evermore Cannabis Company rose from #4 to #3 with 23.2% YoY growth, indicating competitors are either maintaining or widening rank distance as Temple posts a modest single-rank YoY gain. Compared with Beezle Extracts advancing from #6 to #4 and Nature's Heritage slipping from #3 to #5 despite 17.2% YoY growth, Temple’s trajectory suggests stability without momentum, implying that holding in the low-20s risks entrenchment unless share-creating moves convert its small rank uptick into multi-rank advances.
Notable Products
Funk Mountain Hash (3.5g) posted the largest movement in June 2026 with a 98.999% month-over-month surge, yet it held only rank 7 while White 99 Temple Ball Hash (1g) rose 14.4% to defend rank 1. In contrast, Super Skunk Nepalese Hash Ball (1g) fell 62.9% to rank 6 and Gushmints Temple Ball Hash (1g) dropped 40.3% to rank 4, while Gushmints Nepalese Hash Ball (1g) jumped 94.2% into rank 3. With eight of the top ten coming from Concentrates and only one Pre-Roll at rank 8 growing 32.4%, the mix points to Temple consolidating around hash-led SKUs with selective bets on format diversification. The pattern implies Temple is prioritizing high-traction hash variants while pruning or repositioning weaker strains, guiding commercial focus toward Concentrates optimization rather than broad category expansion.
Top Selling Cannabis Brands
Data for this report comes from real-time sales reporting by participating cannabis retailers via their point-of-sale systems, which are linked up with Headset’s business intelligence software. Headset’s data is very reliable, as it comes digitally direct from our partner retailers. However, the potential does exist for misreporting in the instance of duplicates, incorrectly classified products, inaccurate entry of products into point-of-sale systems, or even simple human error at the point of purchase. Thus, there is a slight margin of error to consider. Brands listed on this page are ranked in the top twenty within the market and product category by total retail sales volume.

