.svg)

Sep-2026
Sales
Trend
6-Month
Product Count
SKUs
Avg Price
YoY Sales Change
YoY Price Change


Where to Buy
Exotic Elevations is stocked at 47 licensed dispensaries across Maryland, with the deepest coverage in Baltimore, Hagerstown, Rockville, Annapolis, and Cockeysville. Search by ZIP code or city below to find the closest one, or filter by product type if you are after a specific format.
Market Insights Snapshot
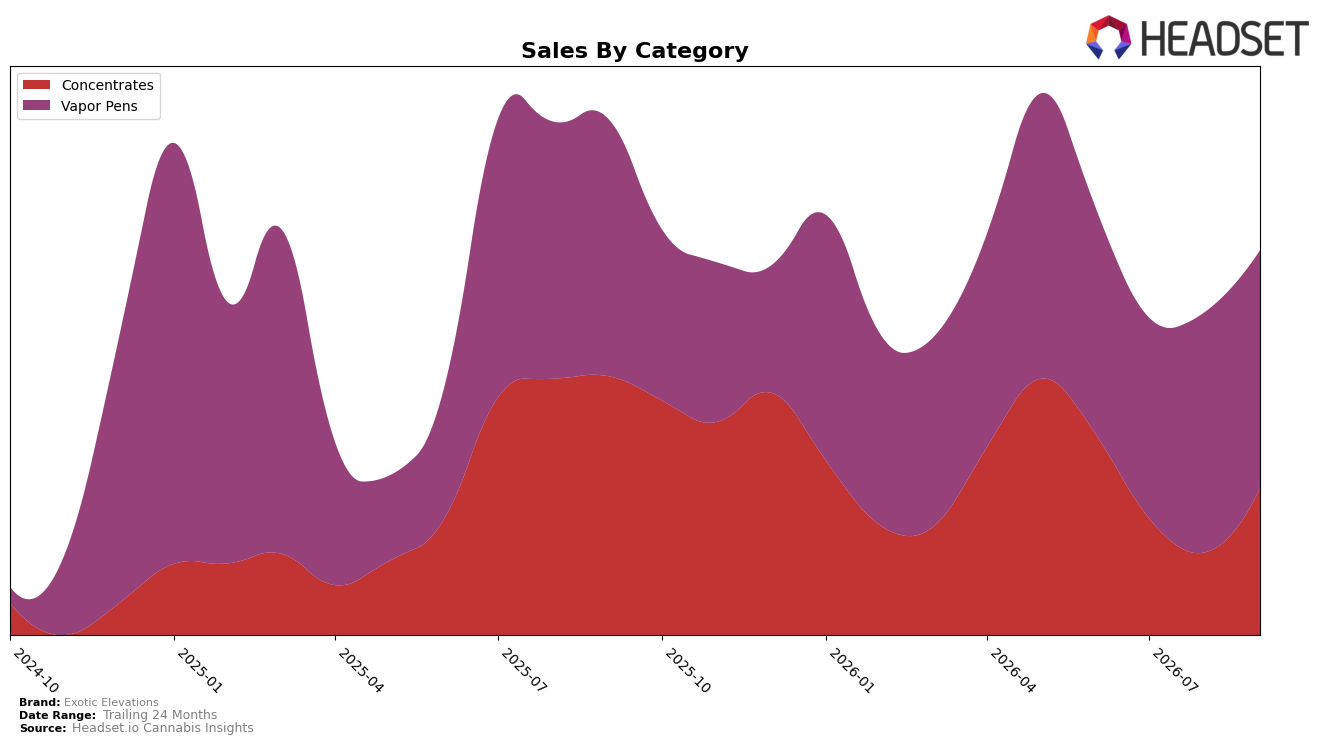
In September 2026, Exotic Elevations concentrated 58.73% of sales in Vapor Pens and 41.27% in Concentrates, a mix that tilts toward Vapor Pens despite a -5.93% year-over-year decline and a -0.69% month-over-month dip in that lead category. Concentrates fell -34.27% year-over-year but rebounded 42.29% month-over-month, indicating a short-term resurgence within a shrinking annual baseline. With average price up 3.48% year-over-year to $44.53 and Vapor Pens averaging $47.27, the pricing ladder remains intact while category volumes diverge. The brand’s overall year-over-year sales decline of -20.14% alongside a 66.33% gain over 24 months implies a retrenchment phase where near-term softness in Vapor Pens is partially offset by a tactical Concentrates bounce, concentrating risk in a two-category portfolio.
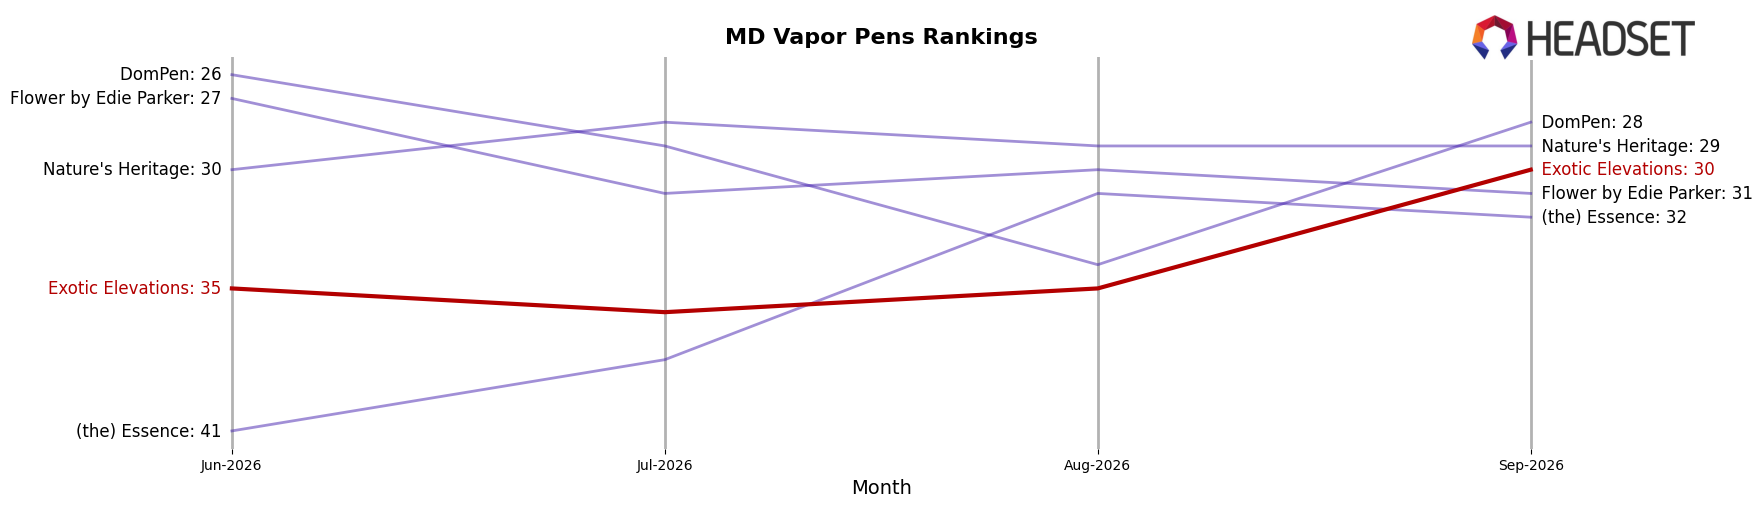
Exotic Elevations holds rank 30 in Vapor Pens in Maryland, a position that, combined with a -0.69% month-over-month Vapor Pens dip and a 42.29% month-over-month lift in Concentrates, suggests immediate share defense in Vapor Pens while leaning on Concentrates for incremental velocity. The -5.93% Vapor Pens year-over-year decline versus the -34.27% in Concentrates indicates the core remains relatively steadier, but the mix’s 58.73% Vapor Pens weight exposes the brand to rank pressure if monthly softness persists. This pattern implies a positioning pivot: stabilize Vapor Pens to protect rank 30 in Maryland while selectively scaling the renewed Concentrates momentum to diversify revenue without diluting price architecture.
Competitive Landscape
Exotic Elevations sits at rank #30 in MD Vapor Pens in September 2026, a 4-place improvement from #34 year over year and a 5-place climb from #35 in June 2026, while still 5 places below its peak of #25 from January 2025; meanwhile, Select held at #1 year over year with 34.1% sales growth and Rove moved up from #8 to #5 alongside 121.3% sales growth, indicating Exotic Elevations’ upward rank drift is occurring amid faster top-tier gains that compress mid-pack mobility.
Notable Products
Straight Chem Live Liquid Diamonds Cartridge (1g) posted the standout move in September 2026 with +232.7% MoM to rank 1, while Black Cherry Soda Live Liquid Diamonds Cartridge (1g) also accelerated at +79.7% MoM into rank 4. In contrast, Hawaiian Gold Live Liquid Resin Diamonds Cartridge (1g) fell -46.7% MoM at rank 9, and AK-47 Live Liquid Diamonds Cartridge (1g) gained +54.9% MoM to rank 8. With four of the top ten coming from Vapor Pens and three of those posting MoM gains above +50%, product momentum is consolidating around Live Liquid Diamonds cartridges, implying a near-term tilt toward inhalable convenience formats over concentrate jars.
Top Selling Cannabis Brands






Data for this report comes from real-time sales reporting by participating cannabis retailers via their point-of-sale systems, which are linked up with Headset’s business intelligence software. Headset’s data is very reliable, as it comes digitally direct from our partner retailers. However, the potential does exist for misreporting in the instance of duplicates, incorrectly classified products, inaccurate entry of products into point-of-sale systems, or even simple human error at the point of purchase. Thus, there is a slight margin of error to consider. Brands listed on this page are ranked in the top twenty within the market and product category by total retail sales volume.

