Jun-2026
Sales
Trend
6-Month
Product Count
SKUs
Avg Price
YoY Sales Change
YoY Price Change
Market Insights Snapshot
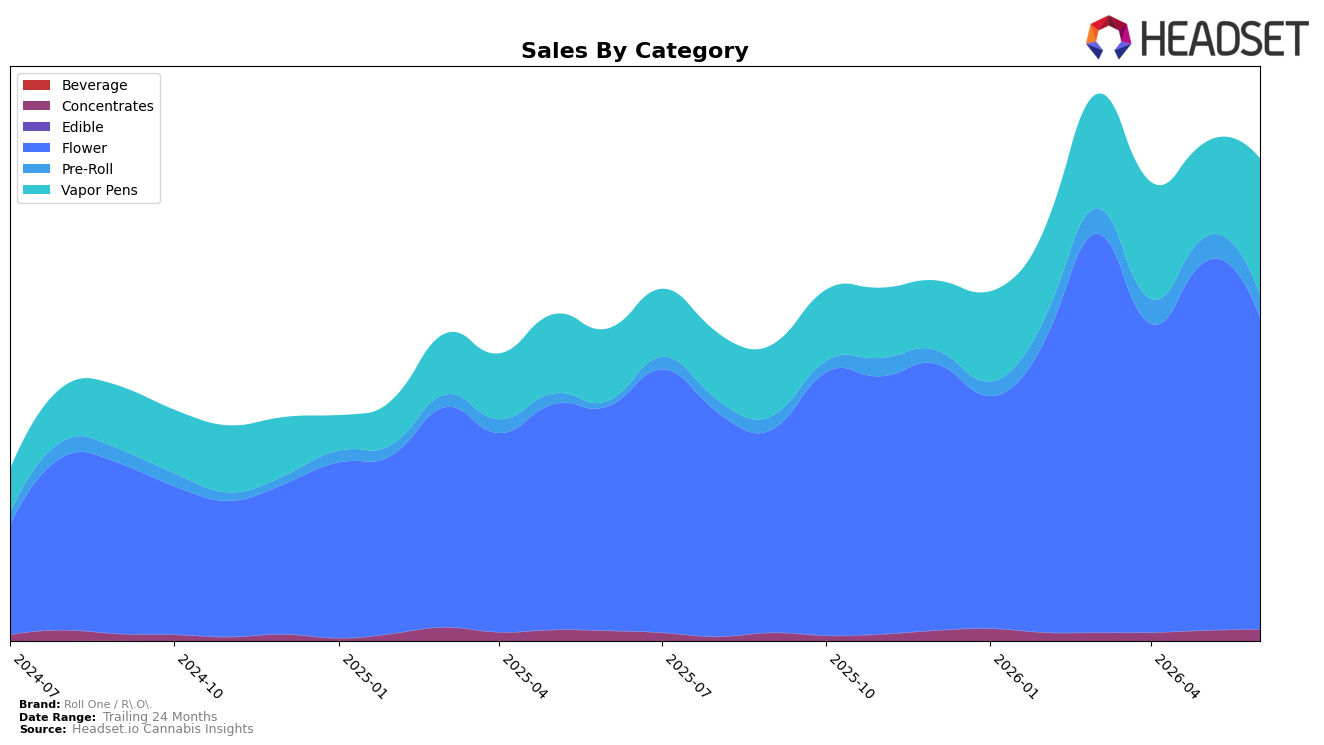
Roll One / R.O.’s mix in June 2026 was dominated by Flower at 64.77% share (ranked 12th in Maryland Flower), but that anchor category fell 15.37% month over month even as it grew 38.90% year over year; in contrast, Vapor Pens rose 44.21% MoM to 28.19% share and climbed 88.77% YoY, indicating a rapid reweighting within inhalables. Pre-Roll held just 4.70% share with a 7.62% MoM dip despite a 339.18% YoY surge, while Concentrates remained small at 2.34% share but advanced 13.18% MoM and 16.26% YoY; paired with a 17.93% YoY decline in average price to $22.86, the pattern implies unit-led expansion where faster-growing, lower-price segments are offsetting a short-term Flower pullback and nudging the portfolio toward cartridges.
The shift toward Vapor Pens gaining 44.21% MoM while Flower contracted 15.37% MoM repositions Roll One / R.O. to compete on value-density and convenience rather than solely on bulk Flower volume; with Flower still at 64.77% share but lagging month to month, the brand’s near-term momentum will hinge on sustaining cartridge velocity and protecting Flower rank at 12 in Maryland. Given Pre-Roll’s 339.18% YoY growth from a small 4.70% base and Concentrates’ 13.18% MoM rise at 2.34% share, the portfolio is diversifying at the edges; combined with the 17.93% YoY price deflation, this implies a deliberate trade-down strategy that can widen buyer entry points but risks diluting Flower mix unless Vapor Pens’ 28.19% share converts into durable repeat and improves cross-category stickiness.
Competitive Landscape
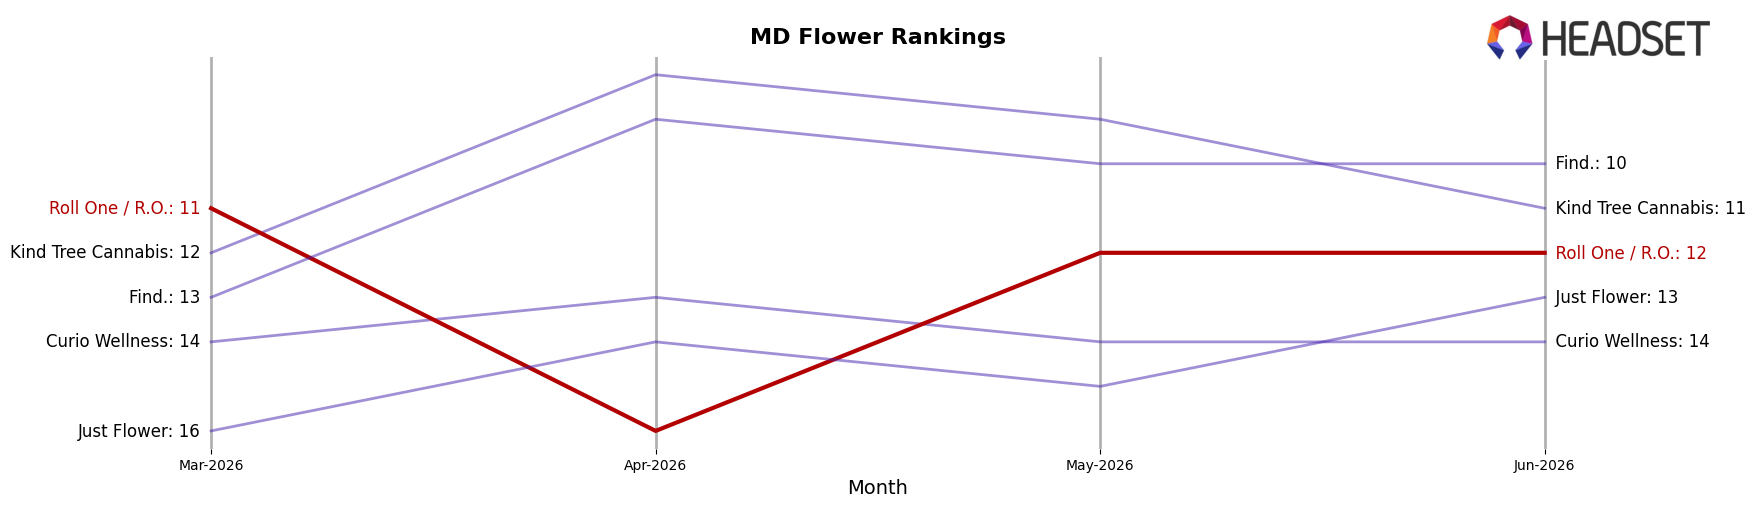
Roll One / R.O. sits at rank #12 in MD Flower in June 2026, down 2 positions year over year from #10, and off 1 spot from March 2026 when it was #11; compared to its peak at #9 in July 2025, the brand is now 3 ranks lower while category leaders shifted as RYTHM climbed from #3 to #2 and Strane moved up from #7 to #4, signaling that rivals with double-digit sales growth rates of 42.7% and 58.8% are compressing mid-tier space where Roll One / R.O. has slipped 2 ranks YoY; the pattern implies that without a mix shift or pricing play that counters faster-moving competitors, the brand’s trajectory points toward further mid-pack drift rather than a return to the top-10.
Notable Products
Pungent Smile (3.5g) posted the standout move in June 2026 with a 97.4% month-over-month surge while holding rank 4, a jump that reshapes the balance between Flower and Vape in the top tier. Chesapeake Crawler (3.5g) remained the anchor at rank 1 as Flower claimed two of the top four positions, whereas five of the top ten are Vapor Pens, signaling a portfolio still concentrated in inhalables even as Flower gains momentum. With seven Vapor Pens clustered between ranks 2 and 10 and no pen showing double-digit MoM acceleration, the mix points toward stabilizing Vape velocity alongside a re-energized Flower push led by one breakout SKU. The pattern implies Roll One / R.O. is pivoting toward higher-impact Flower while maintaining breadth in Vapor Pens for volume defense.
Top Selling Cannabis Brands
Data for this report comes from real-time sales reporting by participating cannabis retailers via their point-of-sale systems, which are linked up with Headset’s business intelligence software. Headset’s data is very reliable, as it comes digitally direct from our partner retailers. However, the potential does exist for misreporting in the instance of duplicates, incorrectly classified products, inaccurate entry of products into point-of-sale systems, or even simple human error at the point of purchase. Thus, there is a slight margin of error to consider. Brands listed on this page are ranked in the top twenty within the market and product category by total retail sales volume.

