.svg)


Where to Buy
The Funnies Gummies is stocked at 107 licensed dispensaries across Illinois, with the deepest coverage in Chicago, Quincy, Springfield, Champaign, and Joliet. Search by ZIP code or city below to find the closest one, or filter by product type if you are after a specific format.
Market Insights Snapshot
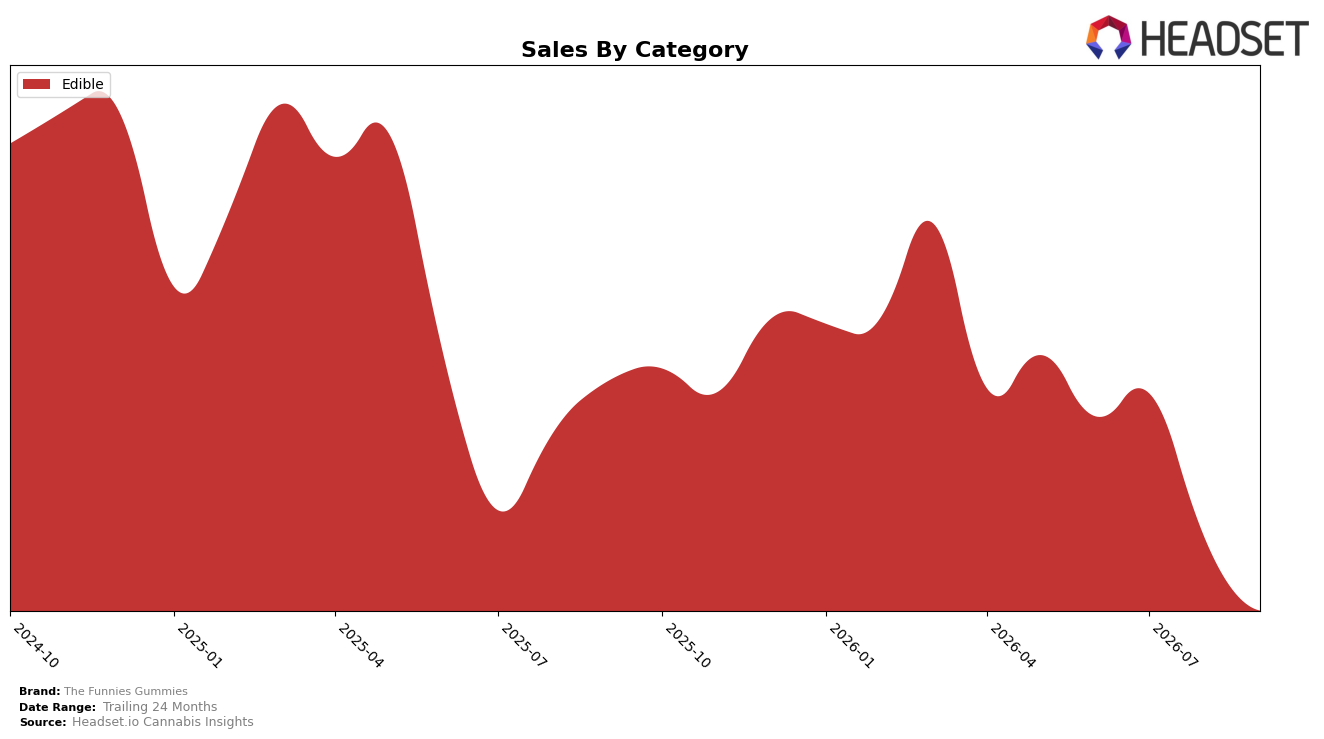
In September 2026, The Funnies Gummies concentrated entirely in Edible, with category share at 100.0% while Edible sales fell 45.96% year over year and 21.22% month over month; average price declined 3.88% YoY to $7.87. Within Illinois Edible, the brand sat at rank 19, indicating a mid-pack position even as the single-category exposure amplified the 21.22% MoM contraction. The pattern implies that single-category reliance magnified downside from category-level softness, and the 3.88% YoY price dip did not offset a 45.96% YoY sales decline, pointing to volume compression rather than mix benefit.
With 100.0% of sales in Edible and a rank of 19 in Illinois, the 45.96% YoY and 21.22% MoM drops suggest price elasticity or distribution drag outweighed the modest 3.88% YoY price reduction. The combination of complete category concentration and a mid-teen rank implies that incremental gains likely require either distribution expansion within Edible or a diversification path, because continued exposure to single-category volatility has already translated into a 62.79% 24-month decline.
Competitive Landscape
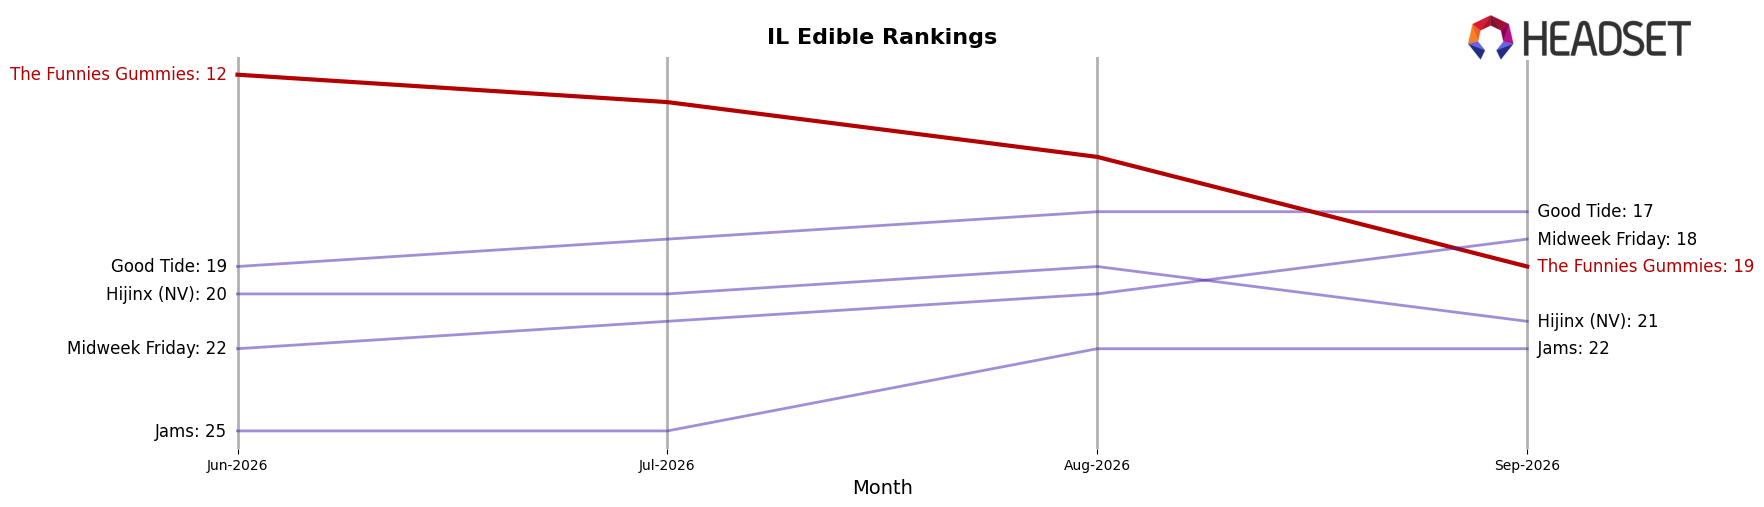
The Funnies Gummies sits at rank 19 in Illinois Edible for September 2026, down 9 positions year over year from rank 10, and 7 spots lower than June 2026 when it held rank 12; compared with its peak of rank 6 in March 2026, the current placement marks a 13-position slide from peak to present. While Incredibles advanced from rank 2 to rank 1 alongside 19.5% year-over-year sales growth and Wyld fell from rank 1 to rank 3 with an 8.0% sales decline, The Funnies Gummies moved the opposite direction of the category leaders, dropping 7 ranks since June 2026 and 9 ranks since September 2025; the pattern implies a loss of share momentum that, if unaddressed, points to continued mid-pack erosion.
Notable Products
Super Funny - Pineapple Mango Mai Tai Gummies 2-Pack (100mg) posted a -51.09% month-over-month change in September 2026 while holding rank 4, outpacing other declines like the -50.53% on the Super Funny - Sour Blue Raspberry Gummy (50mg) at rank 10 and the -49.01% on Strawberry Daiquiri Gummies 20-Pack (100mg) at rank 9, indicating a sharp contraction in single-serve and larger-count line extensions. In contrast, Super Funny - Purely Peach Gummies 2-Pack (100mg) rose +12.20% to rank 1 and Super Funnies - Strawberry Daiquiri Gummies 2-Pack (100mg) climbed +22.29% at rank 3, while Super Funnies - Sour Blue Raspberry Gummies 2-Pack (100mg) increased +6.22% at rank 2; with ten of the top ten SKUs in Edible gummies, the mix is consolidating around 2-Pack leaders even as multi-pack and single 50mg variants retrench. This pattern implies The Funnies Gummies is concentrating demand in a few high-velocity 2-Pack SKUs while pruning or repricing 50mg and larger-count formats to stabilize margin and shelf focus.
Top Selling Cannabis Brands






Data for this report comes from real-time sales reporting by participating cannabis retailers via their point-of-sale systems, which are linked up with Headset’s business intelligence software. Headset’s data is very reliable, as it comes digitally direct from our partner retailers. However, the potential does exist for misreporting in the instance of duplicates, incorrectly classified products, inaccurate entry of products into point-of-sale systems, or even simple human error at the point of purchase. Thus, there is a slight margin of error to consider. Brands listed on this page are ranked in the top twenty within the market and product category by total retail sales volume.

