


Where to Buy
The Happy Camper Cannabis Company is stocked at 47 licensed dispensaries across Oregon and Colorado, 44 of them in Oregon, with the deepest coverage in Portland, Beaverton, Eugene, Gresham, and Milwaukie. Search by ZIP code or city below to find the closest one, or filter by product type if you are after a specific format.
Market Insights Snapshot
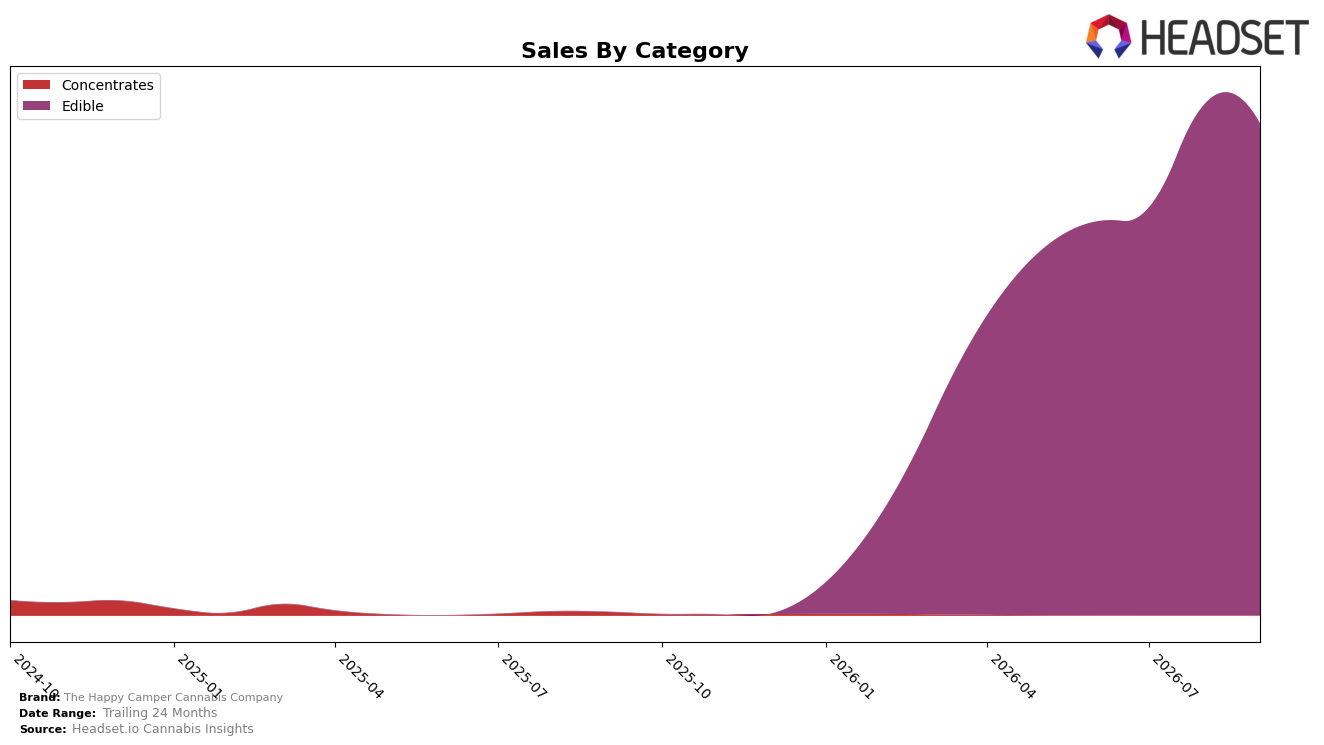
Edible accounted for 100.0% of The Happy Camper Cannabis Company’s mix in September 2026, with a month-over-month change of -3.80% on category sales and a -14.66% year-over-year shift in average price, while brand sales expanded 14,793.87% year over year. Within Oregon Edibles, the brand held rank 16, and its average item price at $6.29 sat against a 4,338.89% 24-month sales increase, implying a volume-led scale-up supported by price compression.
The consolidation into a single category at 100.0% share and rank 16 in Oregon’s Edibles signal a focused positioning that trades margin (down 14.66% in average price YoY) for unit velocity that drove a 14,793.87% YoY sales surge. The -3.80% MoM sales dip alongside a $6.29 average price and a 4,338.89% 24-month sales climb suggests sensitivity to short-cycle fluctuations but durable share-of-voice gains within the Edible set, implying that near-term pricing power is limited while distribution depth and repeat purchase are the primary levers.
Competitive Landscape
The Happy Camper Cannabis Company is ranked #16 in OR Edible for September 2026, holding its peak rank of #16 while improving 2 positions from #18 in June 2026; the flat year-over-year rank data (no recorded prior rank) contrasts with a 2-rank quarter-over-quarter climb that coincides with category stability at the top. Against competitors, Wyld holds #1 with a 4.3% YoY sales lift while Gron / Grön remains #2 with a 5.0% YoY sales decline, and this divergence—leader growth alongside #2 contraction—suggests mid-tier mobility where a #18 to #16 move signals share available from softening incumbents; the pattern implies The Happy Camper Cannabis Company’s current trajectory is incremental ascent within a relatively open middle of the pack.

Notable Products
Green Apple Gummy (100mg) posted the standout move in September 2026 with a +478.3% month-over-month surge that vaulted it to rank 2, while Watermelon Gummy (100mg) slid -16.9% to rank 3. Raspberry Gummy (100mg) also expanded sharply at +93.7% to hold rank 1, concentrating the top of the chart in Edibles where three of the top four are gummies. The two 10-Pack SKUs show mixed momentum, with Apple Gummy 10-Pack (100mg) up +41.3% and Watermelon Gummies 10-Pack (100mg) down -15.0%, indicating format experimentation around value packs without uniform uptake. This pattern implies The Happy Camper Cannabis Company is consolidating share around fruit gummy flagships while selectively testing multi-pack formats to stabilize ranks 1–3 and widen the lead in Edibles.
Top Selling Cannabis Brands



Data for this report comes from real-time sales reporting by participating cannabis retailers via their point-of-sale systems, which are linked up with Headset’s business intelligence software. Headset’s data is very reliable, as it comes digitally direct from our partner retailers. However, the potential does exist for misreporting in the instance of duplicates, incorrectly classified products, inaccurate entry of products into point-of-sale systems, or even simple human error at the point of purchase. Thus, there is a slight margin of error to consider. Brands listed on this page are ranked in the top twenty within the market and product category by total retail sales volume.

