Jun-2026
Sales
Trend
6-Month
Product Count
SKUs
Avg Price
YoY Sales Change
YoY Price Change
Market Insights Snapshot
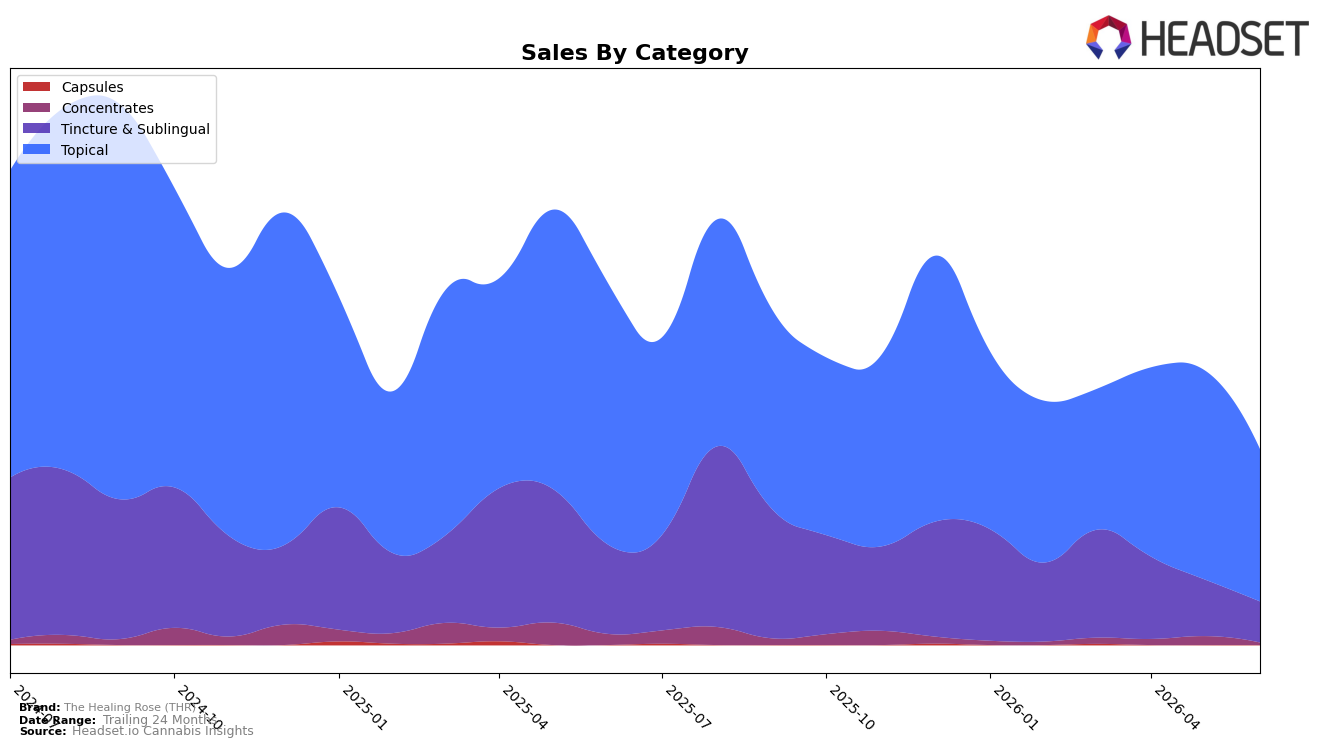
The Healing Rose (THR) concentrated 78.0% share in Topical during June 2026, with Tincture & Sublingual at 20.9% and Concentrates at 1.1%, while total brand sales fell 45.9% year over year and 24-month sales declined 45.4%. Within the mix, Topical dropped 41.7% YoY and 27.2% MoM as Tincture & Sublingual contracted 54.2% YoY and 27.6% MoM, and Concentrates retrenched 79.9% YoY and 74.8% MoM; the brand’s average price decreased 26.1% YoY to $21.62. The pattern implies a defensive tilt toward Topical volume at lower price points while higher-priced Tincture & Sublingual and niche Concentrates compress more rapidly, concentrating exposure in a single category even as that anchor declines on both YoY and MoM bases.
Because Topical now carries 78.0% of sales while falling 27.2% MoM against a 26.1% YoY price decline, the brand’s near-term positioning hinges on value-led Topicals rather than premium formats. With Tincture & Sublingual representing 20.9% share but contracting 54.2% YoY and 27.6% MoM, and Concentrates down 79.9% YoY to just 1.1% share, the mix skews toward lower ticket items and away from premium baskets, implying margin pressure and a need to either deepen penetration in Massachusetts Topicals or re-balance toward formats with less volatile month-over-month swings.
Competitive Landscape
The Healing Rose (THR) is ranked #6 in Massachusetts Topical for June 2026, unchanged year over year at #6, after peaking at #5 in May 2026 and holding #6 across the last three months; this stability contrasts with Sanctuary Medicinals advancing from #9 to #4 alongside a 92.9% YoY sales increase, while Doctor Solomon's held at #5 despite a 33.7% YoY decline and Attune stayed at #3 with a 13.4% YoY drop, as leaders Treeworks and Chill Medicated remained #1 and #2 with YoY gains of 17.5% and 19.3%; the pattern implies THR’s flat rank is more about competitive leapfrogging dynamics than internal contraction, suggesting that maintaining share will require countering rivals’ outsized YoY swings rather than chasing absolute dollar growth.

Notable Products
CBD Relax & Unwind Bath Soak (100mg CBD, 4oz) posted the standout move in June 2026 with +99.1% month over month and climbed to rank 1, while CBD Goddess Revival Bath Soak (300mg CBD, 12oz) fell -42.3% and sat at rank 3. CBD Hippie's Hideaway Bath Soak (100mg CBD, 4oz) also surged +70.2% to rank 2, but CBD Coconut Lip Balm (25mg CBD) dropped -54.9% at rank 8. With six of the top ten being Bath Soak SKUs and only one disclosed raw dollar figure of $1,067 attached to a salve outlier, the pattern implies a pivot toward lower-dose bath soaks as volume leaders while higher-dose formats retrench.
Top Selling Cannabis Brands
Data for this report comes from real-time sales reporting by participating cannabis retailers via their point-of-sale systems, which are linked up with Headset’s business intelligence software. Headset’s data is very reliable, as it comes digitally direct from our partner retailers. However, the potential does exist for misreporting in the instance of duplicates, incorrectly classified products, inaccurate entry of products into point-of-sale systems, or even simple human error at the point of purchase. Thus, there is a slight margin of error to consider. Brands listed on this page are ranked in the top twenty within the market and product category by total retail sales volume.

